

Question: You were given Table 1, below. Recreate Table 2 in an Excel spreadsheet and complete the yellow highlighted areas by creating excel formulas to
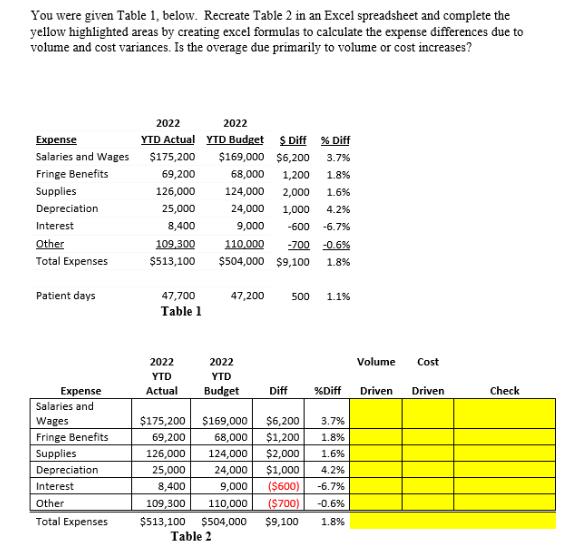
You were given Table 1, below. Recreate Table 2 in an Excel spreadsheet and complete the yellow highlighted areas by creating excel formulas to calculate the expense differences due to volume and cost variances. Is the overage due primarily to volume or cost increases? Expense Salaries and Wages Fringe Benefits Supplies Depreciation Interest Other Total Expenses Patient days Expense Salaries and Wages Fringe Benefits Supplies Depreciation Interest Other Total Expenses 2022 YTD Actual $175,200 69,200 126,000 25,000 8,400 109,300 $513,100 47,700 Table 1 2022 YTD Actual 2022 YTD Budget $ Diff % Diff $169,000 $6,200 3.7% 1.8% 1.6% 4.2% -6.7% 68,000 1,200 124,000 2,000 24,000 1,000 9,000 -600 110,000 $504,000 $9,100 47,200 2022 YTD Budget -700 -0.6% 1.8% $175,200 $169,000 69,200 126,000 25,000 8,400 500 1.1% Volume Cost Diff %Diff Driven Driven $6,200 3.7% 68,000 $1,200 1.8% 124,000 $2,000 1.6% 24,000 $1,000 4.2% 9,000 ($600) -6.7% 109,300 110,000 ($700) -0.6% $513,100 $504,000 $9,100 1.8% Table 2 Check
Step by Step Solution
3.34 Rating (169 Votes )
There are 3 Steps involved in it
SOLUTION To recreate Table 2 in an Excel spreadsheet and calculate the expense differences due to volume and cost variances you can follow these steps ... View full answer

Get step-by-step solutions from verified subject matter experts