

Question: You will apply the statistical concepts and techniques covered in this week's reading about correlation coefficients and simple linear regression. A car rental company wants
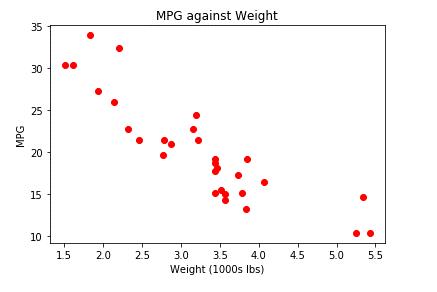
You will apply the statistical concepts and techniques covered in this week's reading about correlation coefficients and simple linear regression. A car rental company wants to evaluate the premise that heavier cars are less fuel efficient than lighter cars. In other words, the company expects that fuel efficiency (miles per gallon) and the weight of the car (often measured in thousands of pounds) are correlated. Performing this analysis will help the company optimize its business model and charge its customers appropriately.
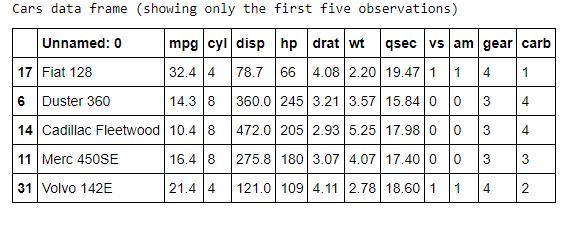
In this discussion, you will work with a cars data set that includes two variables:
Miles per gallon (coded as mpg in the data set)
Weight of the car (coded as wt in the data set)
The random sample will be drawn from a CSV file. This data will be unique to you, and therefore your answers will be unique as well. Run Step 1 in the Python script to generate your unique sample data.
In your initial post, address the following items:
1. You created a scatterplot of miles per gallon against weight; check to make sure it was included in your attachment. Does the graph show any trend? If yes, is the trend what you expected? Why or why not? See Step 2 in the Python script.
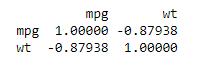
2. What is the coefficient of correlation between miles per gallon and weight? What is the sign of the correlation coefficient? Does the coefficient of correlation indicate a strong correlation, weak correlation, or no correlation between the two variables? How do you know? See Step 3 in the Python script.
3. Write the simple linear regression equation for miles per gallon as the response variable and weight as the predictor variable. How might the car rental company use this model? See Step 4 in the Python script.
4. What is the slope coefficient? Is this coefficient significant at a 5% level of significance (alpha=0.05)? (Hint: Check the P-value, , for weight in the Python output.) See Step 4 in the Python script.
![Warnings: [1] Standard Errors assume that the covariance matrix of the errors is correctly specified.](https://dsd5zvtm8ll6.cloudfront.net/si.experts.images/questions/2023/03/6414151ef01d6_1679037726082.jpg)
Cars data frame (showing only the first five observations) mpg cyl disp hp drat wt 32.4 4 78.7 66 4.08 2.20 19.47 1 1 4 14.3 8 3 10.4 8 3 16.4 8 3 21.4 4 Unnamed: 0 17 Fiat 128 6 Duster 360 14 Cadillac Fleetwood 11 Merc 450SE 31 Volvo 142E qsec vs am gear carb 1 4 4 3 360.0 245 3.21 3.57 15.84 0 472.0 205 2.93 5.25 17.98 0 275.8 180 3.07 4.07 17.40 0 121.0 109 4.11 2.78 18.60 1 0 0 0 1 4 st 2
Step by Step Solution
3.42 Rating (152 Votes )
There are 3 Steps involved in it
Solutions Step 1 Claim the factory claims that the proportion of ball bearings with diameter values less than 220 cm in the existing manufacturing pro... View full answer

Get step-by-step solutions from verified subject matter experts