

Question: You will be proforming a descriptive statistics analysis. Interpret the data. If there have an association between cholesterol and alcoholic, race, smoking and exercise Statistics
You will be proforming a descriptive statistics analysis. Interpret the data. If there have an association between cholesterol and alcoholic, race, smoking and exercise
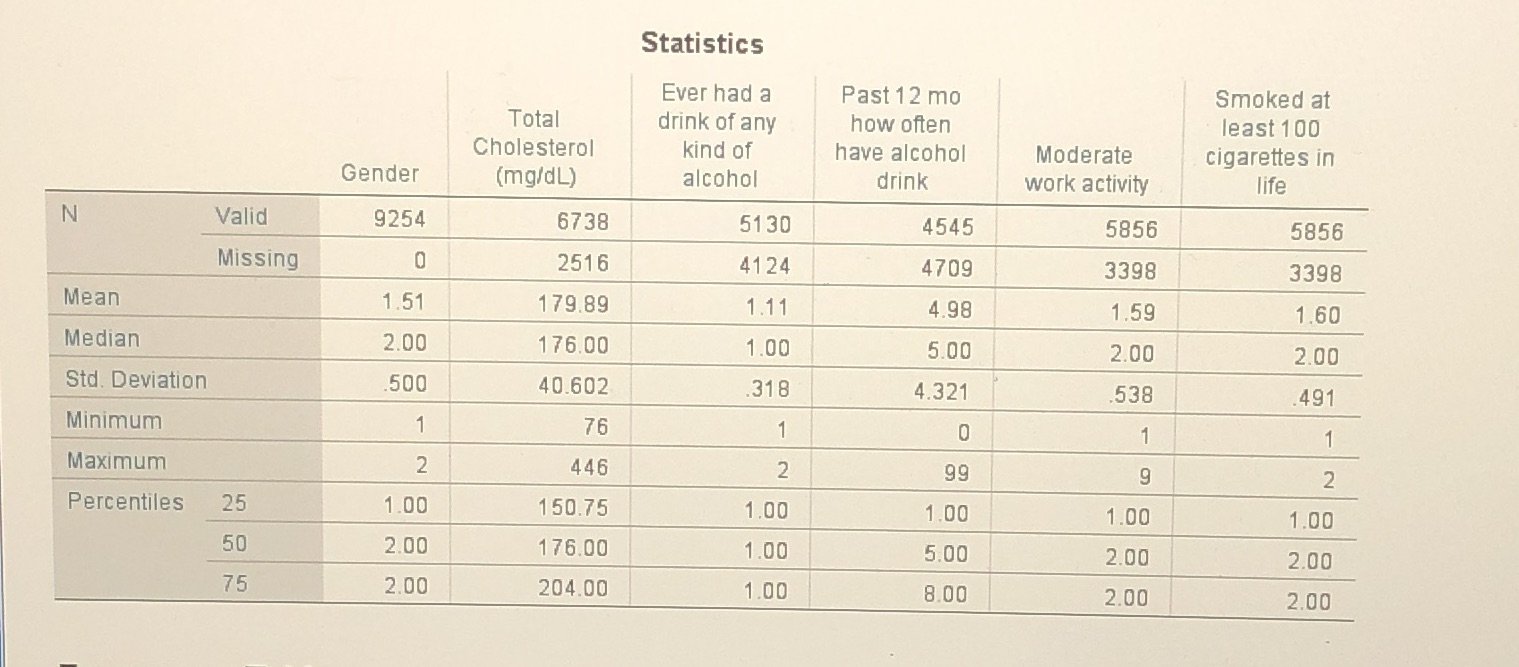
Statistics Ever had a Past 12 mo Smoked at Total drink of any how often least 100 Cholesterol kind of have alcohol Moderate cigarettes in Gender (mg/dL) alcohol drink work activity life N Valid 9254 6738 5130 4545 5856 5856 Missing 0 2516 4124 4709 3398 3398 Mean 1.51 179.89 1.11 4.98 1.59 1.60 Median 2.00 176.00 1.00 5.00 2.00 2.00 Std. Deviation .500 40.602 318 4.321 538 491 Minimum 1 76 1 0 1 Maximum 2 446 2 99 9 2 Percentiles 25 1.00 150.75 1.00 1.00 1.00 1.00 50 2.00 176.00 1.00 5.00 2.00 2.00 75 2.00 204.00 1.00 8.00 2.00 2.00
Step by Step Solution
There are 3 Steps involved in it

Get step-by-step solutions from verified subject matter experts