

Question: You will be writing three different Python programs, and you will upload a single zip file named Hw5_yourname.zip. Name your python files - hw5a.py, hw5b
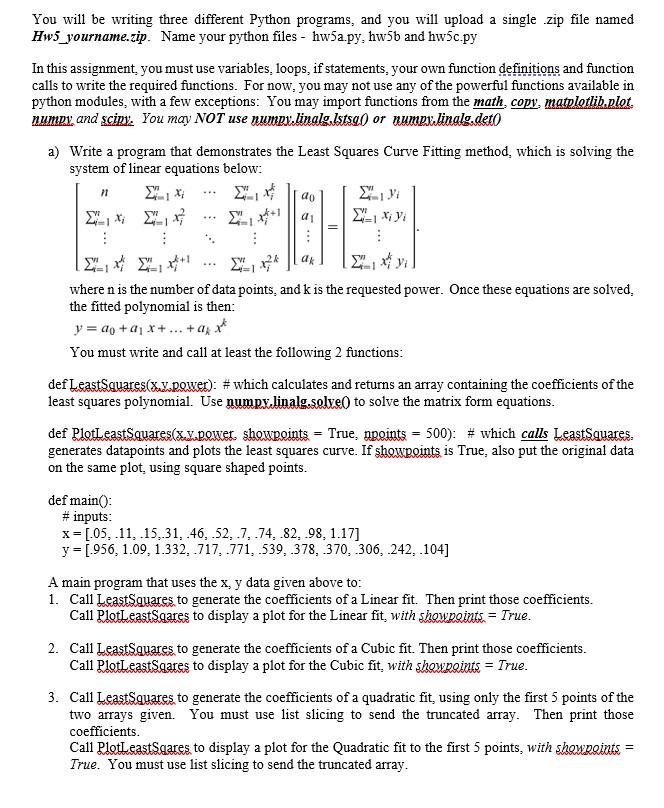
You will be writing three different Python programs, and you will upload a single zip file named Hw5_yourname.zip. Name your python files - hw5a.py, hw5b and hw5c.py In this assignment, you must use variables, loops, if statements, your own function definitions and function calls to write the required functions. For now, you may not use any of the powerful functions available in python modules, with a few exceptions: You may import functions from the math, copy, matplotlib,plot, numpy and scipy. You may NOT use numpi. linalg.lstsad or numpilinalg.deto a) Write a program that demonstrates the Least Squares Curve Fitting method, which is solving the system of linear equations below: where n is the number of data points, and k is the requested power. Once these equations are solved, the fitted polynomial is then: y=a0+a1x++akxk You must write and call at least the following 2 functions: def LeastSquares(xuypower): \# which calculates and returns an array containing the coefficients of the least squares polynomial. Use numpx.linalg solve0 to solve the matrix form equations. def PlotLeastSquares (x y power showpoints = True, npoints =500 ): \# which calls LeastSquares, generates datapoints and plots the least squares curve. If showpoints is True, also put the original data on the same plot, using square shaped points. defmain():#inputs:x=[.05,.11,.15,31,.46,.52,.7,.74,.82,.98,1.17]y=[.956,1.09,1.332,.717,.771,.539,.378,.370,.306,.242,.104] A main program that uses the x,y data given above to: 1. Call LeastSquares to generate the coefficients of a Linear fit. Then print those coefficients. Call PlotLeastSoares to display a plot for the Linear fit, with showpoints = True. 2. Call LeastSquares to generate the coefficients of a Cubic fit. Then print those coefficients. Call PlotLeastSaares to display a plot for the Cubic fit, with shownoints = True . 3. Call LeastSquares to generate the coefficients of a quadratic fit, using only the first 5 points of the two arrays given. You must use list slicing to send the truncated array. Then print those coefficients. Call PlotLeastSgares to display a plot for the Quadratic fit to the first 5 points, with showpoints= True. You must use list slicing to send the truncated array
Step by Step Solution
There are 3 Steps involved in it

Get step-by-step solutions from verified subject matter experts