

Question: You will calculate ratios for each classification for the 3 years of data (i.e., the current ratio may have been 1.5 the first year, 1.35
You will calculate ratios for each classification for the 3 years of data (i.e., the current ratio may have been 1.5 the first year, 1.35 the second year, and .75 in the most recent year). It is based on these results that you will measure financial performance, or trends, from one year to the next. It is imperative that the ratios-numbers, and quantitative outcomes, support your analysis.
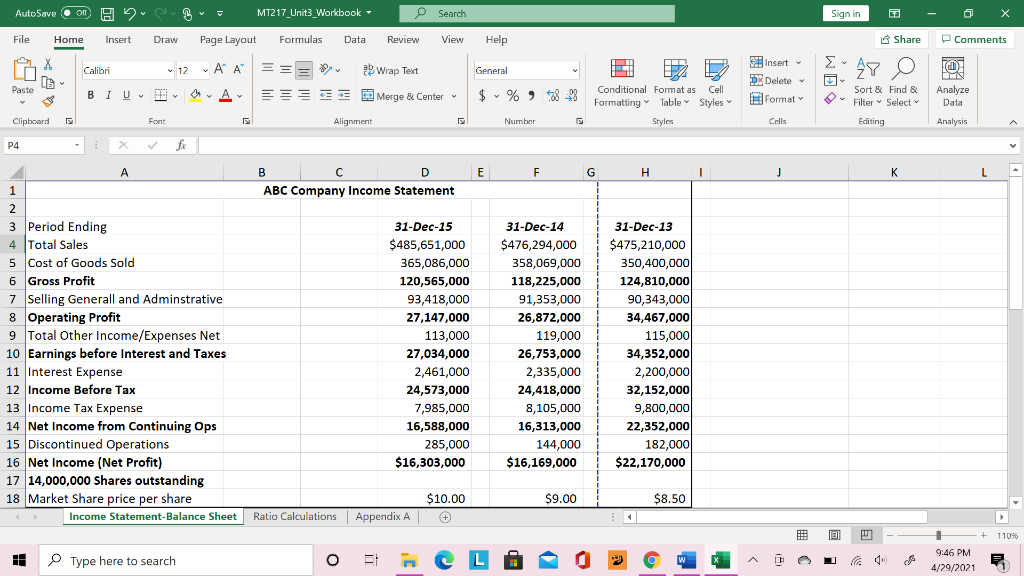
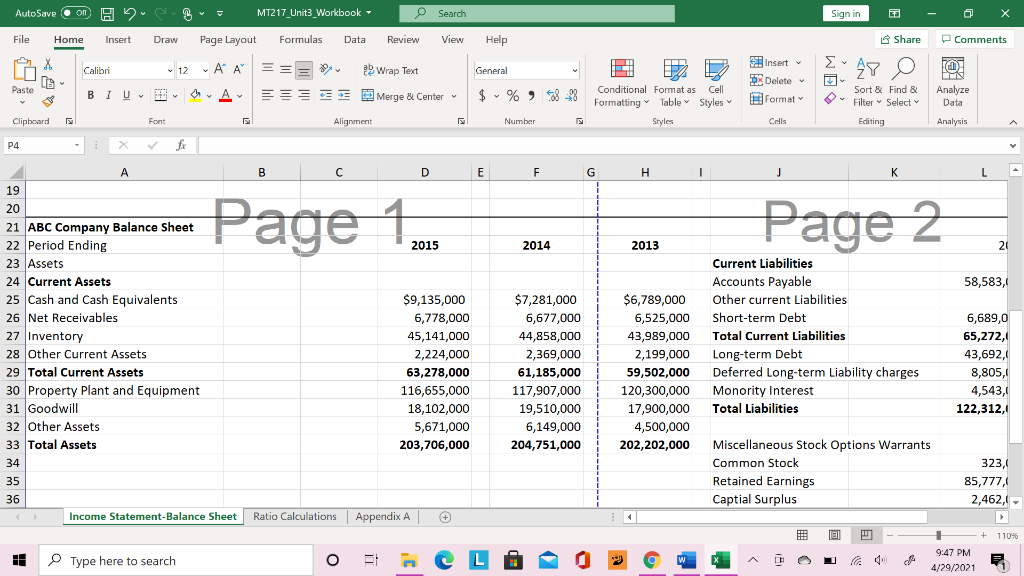
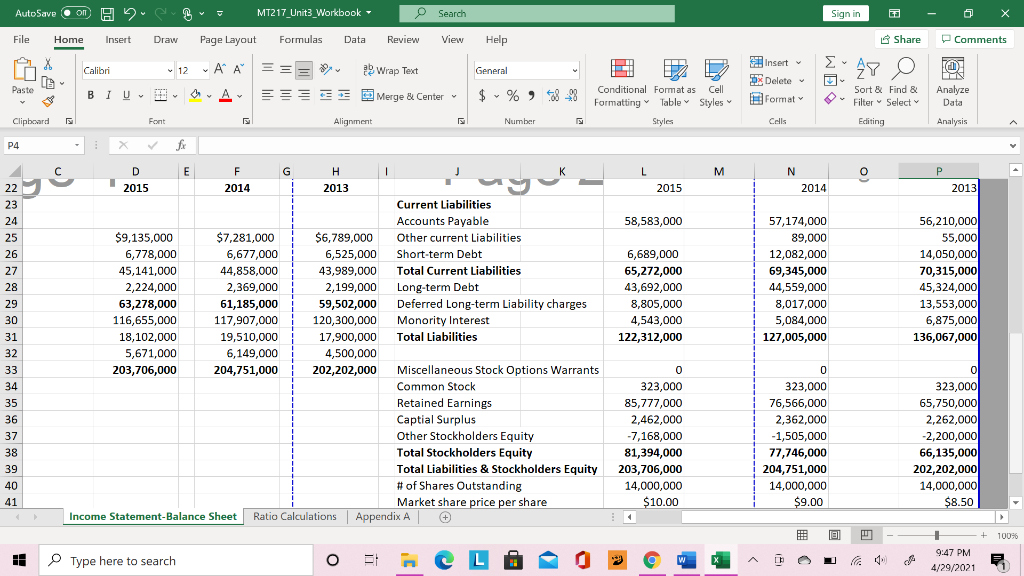
- Using the data from the Income Statement and Balance Sheet, provide the correct calculation of the liquidity ratios and an assessment of the companys ability to maintain liquidity and the management of current assets and current liabilities. Include the proper assessment of outcomes as positive or negative trends when all ratio outcomes are factored as a group.
Liquidity Ratios
- Current Ratio
- Quick Ratio
The CEO of your company is forming a task force to review the financials and present a review for acquisition of ABC Company. Based on ABCs previous 3 years of financials, determine if this would be a good acquisition.
The CEO would like most of the departments to participate in the process. Using each departments area of expertise, what information would each of the following departments contribute to the final decision? Provide a minimum one-paragraph response
- Finance Department
perform an overall analysis to explain your recommendation to the CEO. Your analysis should include the following:
- Explain how the company is trending based on the year-over-year ratios.
AutoSave Oom A MT217_Unit3_Workbook Search Sign in Ga o File Home Insert Draw Page Layout Formulas Data Review View Help Share Comments Wrap Text X 09 General ITI @ Insert DX Delete Calibri - 12 AA BURU D A Pasto * Merge & Center $ % -99 Format Conditional Format as Cell Formatting Table Styles Styles Sort & Find & Filter Select Analyze Data Clipboard Font Alignment Number Cels Editing Analysis P4 fx A E F G H 1 J K L B D ABC Company Income Statement 1 2. 3 Period Ending 4 Total Sales 5 Cost of Goods Sold 6 Gross Profit 7 Selling Generall and Adminstrative 8 Operating Profit 9 Total Other Income/Expenses Net 10 Earnings before Interest and Taxes 11 Interest Expense 12 Income Before Tax 13 Income Tax Expense 14 Net Income from Continuing Ops 15 Discontinued Operations 16 Net Income (Net Profit) 17 14,000,000 shares outstanding 18 Market Share price per share Income Statement-Balance Sheet 31-Dec-15 $485,651,000 365,086,000 120,565,000 93,418,000 27,147,000 113,000 27,034,000 2,461,000 24,573,000 7,985,000 16,588,000 285,000 $16,303,000 31-Dec-14 $476,294,000 358,069,000 118,225,000 91,353,000 26,872,000 119,000 26,753,000 2,335,000 24,418,000 8,105,000 16,313,000 144,000 $16,169,000 31-Dec-13 $475,210,000 350,400,000 124,810,000 90,343,000 34,467,000 115,000 34,352,000 2,200,000 32,152,000 9,800,000 22,352,000 182,000 $22,170,000 $10.00 $9.00 $8.50 Ratio Calculations Appendix A jal 1106 H Type here to search O Et CL 4 9:46 PM 4/29/2021 AutoSave Oom A MT217_Unit3_Workbook - Search Sign in Ga o File Home Insert Draw Page Layout Formulas Data Review View Help Share Comments Calibri X 09 - 12 AA Wrap Text General III @ Insert 5x Delete Format Pasto BIU D A + Merge & Center $ %$8-98 Conditional Format as Cell Formatting Table Styles Styles Sort & Find & Filter Select Editing Analyze Data Clipboard Font Alignment Number CHI Analysis P4 fx A B D E F F. G H 1 1 J K L Page 1 , Page 2 2015 2014 2013 21 58,583, 19 20 21 ABC Company Balance Sheet 22 Period Ending 23 Assets 24 Current Assets 25 Cash and Cash Equivalents 26 Net Receivables 27 Inventory 28 Other Current Assets 29 Total Current Assets 30 Property Plant and Equipment 31 Goodwill 32 Other Assets 33 Total Assets 34 $9,135,000 6,778,000 45,141,000 2,224,000 63,278,000 116,655,000 18,102,000 5,671,000 203,706,000 $7,281,000 6,677,000 44,858,000 2,369,000 61,185,000 117,907,000 19,510,000 6,149,000 204,751,000 $6,789,000 6,525,000 43,989,000 2,199,000 59,502,000 120,300,000 17,900,000 4,500,000 202,202,000 Current Liabilities Accounts Payable Other current Liabilities Short-term Debt Total Current Liabilities Long-term Debt Deferred Long-term Liability charges Monority Interest Total Liabilities 6,689,0 65,272, 43,692, 8,805, 4,543,1 122,312, 323, Miscellaneous Stock Options Warrants Common Stock Retained Earnings Captial Surplus 35 36 85,777, 2,462,- Income Statement-Balance Sheet Ratio Calculations Appendix A al + 110% H Type here to search . nCL 4 9:47 PM 4/29/2021 AutoSave on H MT217_Unit3_Workbook - Search Sign in Ga o File Home Insert Formulas Data Review View Help Share Comments Draw Page Layout - 12 AA MA Calibri X 09 Wrap Text General ITI Insert 5x Delete @ Paste BIU * Merge & Center $ %) $80 Format Conditional Format as Cell Formatting Table Styles Styles Sort & Find & Filter Select Analyze Data Clipboard Font Alignment Number Cels Editing Analysis P4 M uy N 2014 o 2013 57,174,000 89,000 12,082,000 69,345,000 44,559,000 8,017,000 5,084,000 127,005,000 22 23 24 25 26 27 28 29 30 31 31 22 32 33 34 35 36 37 38 39 40 41 56,210,000 55,000 14,050,000 70,315,000 45,324,000 13,553,000 6,875,000 136,067,000 D E F G H L L 2015 2014 2013 2015 Current Liabilities Accounts Payable 58,583,000 $9,135,000 $7.281.000 $6,789,000 Other current Liabilities 6,778,000 6,677,000 6,525,000 Short-term Debt 6,689,000 45,141,000 44,858,000 43,989,000 Total Current Liabilities 65,272,000 2,224,000 2,369,000 2,199,000 Long-term Debt 43,692,000 63,278,000 61,185,000 59,502,000 Deferred Long-term Liability charges 8,805,000 116,655,000 117,907,000 120,300,000 Monority Interest 4,543,000 18,102,000 19,510,000 17,900,000 Total Liabilities 122,312,000 5,671,000 6,149,000 4,500,000 203,706,000 204,751,000 202,202,000 Miscellaneous Stock Options Warrants 0 Common Stock Retained Earnings 85,777,000 Captial Surplus 2,462,000 Other Stockholders Equity -7,168,000 Total Stockholders Equity 81,394,000 Total Liabilities & Stockholders Equity 203,706,000 # of Shares Outstanding 14,000,000 Market share price per share $10.00 Income Statement-Balance Sheet Ratio Calculations Appendix A # 0 323,000 323,000 76,566,000 2,362,000 -1,505,000 77,746,000 204,751,000 14,000,000 $9.00 0 0 323,000 65,750,000 2,262,000 -2.200,000 66,135,000 202,202,000 14,000,000 $8.50 18 + 100% H Type here to search BI CL 4 9:47 PM 4/29/2021 AutoSave Oom A MT217_Unit3_Workbook Search Sign in Ga o File Home Insert Draw Page Layout Formulas Data Review View Help Share Comments Wrap Text X 09 General ITI @ Insert DX Delete Calibri - 12 AA BURU D A Pasto * Merge & Center $ % -99 Format Conditional Format as Cell Formatting Table Styles Styles Sort & Find & Filter Select Analyze Data Clipboard Font Alignment Number Cels Editing Analysis P4 fx A E F G H 1 J K L B D ABC Company Income Statement 1 2. 3 Period Ending 4 Total Sales 5 Cost of Goods Sold 6 Gross Profit 7 Selling Generall and Adminstrative 8 Operating Profit 9 Total Other Income/Expenses Net 10 Earnings before Interest and Taxes 11 Interest Expense 12 Income Before Tax 13 Income Tax Expense 14 Net Income from Continuing Ops 15 Discontinued Operations 16 Net Income (Net Profit) 17 14,000,000 shares outstanding 18 Market Share price per share Income Statement-Balance Sheet 31-Dec-15 $485,651,000 365,086,000 120,565,000 93,418,000 27,147,000 113,000 27,034,000 2,461,000 24,573,000 7,985,000 16,588,000 285,000 $16,303,000 31-Dec-14 $476,294,000 358,069,000 118,225,000 91,353,000 26,872,000 119,000 26,753,000 2,335,000 24,418,000 8,105,000 16,313,000 144,000 $16,169,000 31-Dec-13 $475,210,000 350,400,000 124,810,000 90,343,000 34,467,000 115,000 34,352,000 2,200,000 32,152,000 9,800,000 22,352,000 182,000 $22,170,000 $10.00 $9.00 $8.50 Ratio Calculations Appendix A jal 1106 H Type here to search O Et CL 4 9:46 PM 4/29/2021 AutoSave Oom A MT217_Unit3_Workbook - Search Sign in Ga o File Home Insert Draw Page Layout Formulas Data Review View Help Share Comments Calibri X 09 - 12 AA Wrap Text General III @ Insert 5x Delete Format Pasto BIU D A + Merge & Center $ %$8-98 Conditional Format as Cell Formatting Table Styles Styles Sort & Find & Filter Select Editing Analyze Data Clipboard Font Alignment Number CHI Analysis P4 fx A B D E F F. G H 1 1 J K L Page 1 , Page 2 2015 2014 2013 21 58,583, 19 20 21 ABC Company Balance Sheet 22 Period Ending 23 Assets 24 Current Assets 25 Cash and Cash Equivalents 26 Net Receivables 27 Inventory 28 Other Current Assets 29 Total Current Assets 30 Property Plant and Equipment 31 Goodwill 32 Other Assets 33 Total Assets 34 $9,135,000 6,778,000 45,141,000 2,224,000 63,278,000 116,655,000 18,102,000 5,671,000 203,706,000 $7,281,000 6,677,000 44,858,000 2,369,000 61,185,000 117,907,000 19,510,000 6,149,000 204,751,000 $6,789,000 6,525,000 43,989,000 2,199,000 59,502,000 120,300,000 17,900,000 4,500,000 202,202,000 Current Liabilities Accounts Payable Other current Liabilities Short-term Debt Total Current Liabilities Long-term Debt Deferred Long-term Liability charges Monority Interest Total Liabilities 6,689,0 65,272, 43,692, 8,805, 4,543,1 122,312, 323, Miscellaneous Stock Options Warrants Common Stock Retained Earnings Captial Surplus 35 36 85,777, 2,462,- Income Statement-Balance Sheet Ratio Calculations Appendix A al + 110% H Type here to search . nCL 4 9:47 PM 4/29/2021 AutoSave on H MT217_Unit3_Workbook - Search Sign in Ga o File Home Insert Formulas Data Review View Help Share Comments Draw Page Layout - 12 AA MA Calibri X 09 Wrap Text General ITI Insert 5x Delete @ Paste BIU * Merge & Center $ %) $80 Format Conditional Format as Cell Formatting Table Styles Styles Sort & Find & Filter Select Analyze Data Clipboard Font Alignment Number Cels Editing Analysis P4 M uy N 2014 o 2013 57,174,000 89,000 12,082,000 69,345,000 44,559,000 8,017,000 5,084,000 127,005,000 22 23 24 25 26 27 28 29 30 31 31 22 32 33 34 35 36 37 38 39 40 41 56,210,000 55,000 14,050,000 70,315,000 45,324,000 13,553,000 6,875,000 136,067,000 D E F G H L L 2015 2014 2013 2015 Current Liabilities Accounts Payable 58,583,000 $9,135,000 $7.281.000 $6,789,000 Other current Liabilities 6,778,000 6,677,000 6,525,000 Short-term Debt 6,689,000 45,141,000 44,858,000 43,989,000 Total Current Liabilities 65,272,000 2,224,000 2,369,000 2,199,000 Long-term Debt 43,692,000 63,278,000 61,185,000 59,502,000 Deferred Long-term Liability charges 8,805,000 116,655,000 117,907,000 120,300,000 Monority Interest 4,543,000 18,102,000 19,510,000 17,900,000 Total Liabilities 122,312,000 5,671,000 6,149,000 4,500,000 203,706,000 204,751,000 202,202,000 Miscellaneous Stock Options Warrants 0 Common Stock Retained Earnings 85,777,000 Captial Surplus 2,462,000 Other Stockholders Equity -7,168,000 Total Stockholders Equity 81,394,000 Total Liabilities & Stockholders Equity 203,706,000 # of Shares Outstanding 14,000,000 Market share price per share $10.00 Income Statement-Balance Sheet Ratio Calculations Appendix A # 0 323,000 323,000 76,566,000 2,362,000 -1,505,000 77,746,000 204,751,000 14,000,000 $9.00 0 0 323,000 65,750,000 2,262,000 -2.200,000 66,135,000 202,202,000 14,000,000 $8.50 18 + 100% H Type here to search BI CL 4 9:47 PM 4/29/2021
Step by Step Solution
There are 3 Steps involved in it

Get step-by-step solutions from verified subject matter experts