

Question: You will extract cash flows and then using some kind of beta apply CAPM to discount the cash flows you predict. You can use Year
You will extract cash flows and then using some kind of beta apply CAPM to discount the cash flows you predict. You can use Year 7 EBITDA*(1+g) divided by (r-g) for beyond year 7. For g, you can use 2.5%) thank you!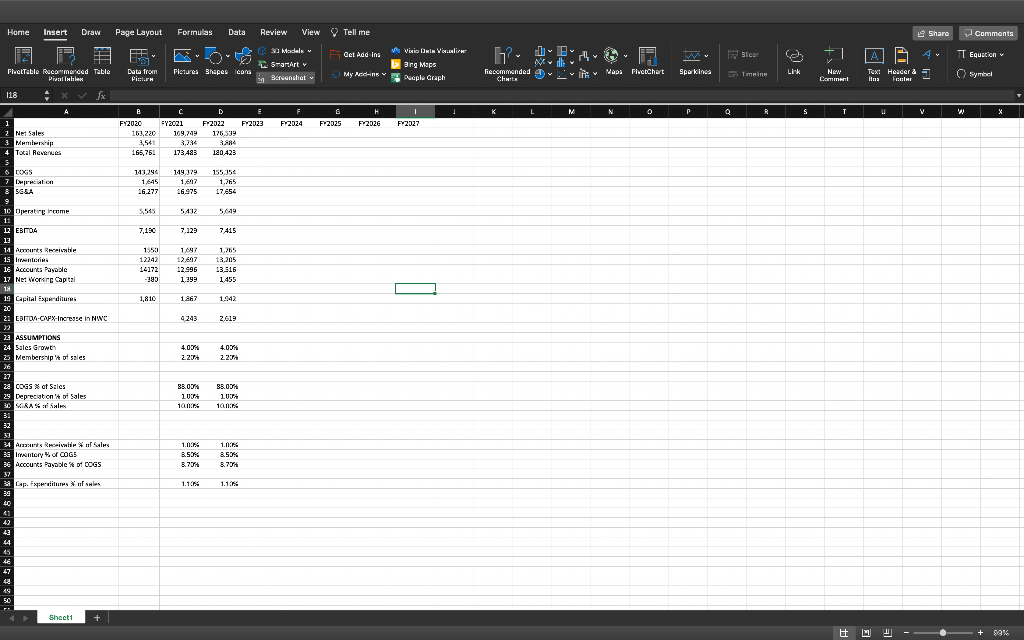
Home Insert Draw Page Layout Formulas Data Review View Tell me Share Comments ROS Fet Adidina i Vino De Visalire By Bor A Av Equation Madels StartArt Sereenshot Data from Pic Pictures Shapes icon FhotTable Recommended Table Pisar Tables ang Maps Deeple Graph Spurkina Recommended - Mapa Pictchart Now Dartment Text Header & to Footer Symbol 118 A E K L N o P Q R S . V X FY2023 F24 F 2025 FY2026 FY2027 2 Net Sales 3 Memleri 4 Tocal Revenue B FY2020 169,220 2541 165,761 FY2021 109.749 3,234 173.483 D FY2022 175,539 3.4 180423 O COGS 7 Dreion 3 A 143.296 1,645 16.277 1,617 16.975 155.354 1,765 17,654 5545 5432 549 7,180 7.120 7415 10 Operating Income 11 12 EBITO 13 Ammunit 15 renterias 16 Accounts Payable 17 Net Worn Capital 12 19 Capital Expeditures 1553 12242 14172 -383 1/47 12.647 12.996 1.399 1,765 13,205 13.316 1.455 1.810 1867 1.942 21 EBITDA- CFX-Increase in NWC 4.243 zole 4.051 2.27 4.06 2.214 23 ASSUMPTIONS 24 Sales Growth 23 Membership of sales 26 27 COGS X of Sales 29 Depreciat on't of Sales 30 YRA Sales 3. 32 88.00 10 100: 88.00 LUTA 10.0: 34 Az Oriol Sales 3 vntory of COGS 36 Accounts Payable of COGS 1.0: 35% 8.704 1.0 TS 8.53% 3.79 Cap. Frums of sales 1.1.1 1.115 39 42 44 19 LE 43 Sheet1 + + SAK Home Insert Draw Page Layout Formulas Data Review View Tell me Share Comments ROS Fet Adidina i Vino De Visalire By Bor A Av Equation Madels StartArt Sereenshot Data from Pic Pictures Shapes icon FhotTable Recommended Table Pisar Tables ang Maps Deeple Graph Spurkina Recommended - Mapa Pictchart Now Dartment Text Header & to Footer Symbol 118 A E K L N o P Q R S . V X FY2023 F24 F 2025 FY2026 FY2027 2 Net Sales 3 Memleri 4 Tocal Revenue B FY2020 169,220 2541 165,761 FY2021 109.749 3,234 173.483 D FY2022 175,539 3.4 180423 O COGS 7 Dreion 3 A 143.296 1,645 16.277 1,617 16.975 155.354 1,765 17,654 5545 5432 549 7,180 7.120 7415 10 Operating Income 11 12 EBITO 13 Ammunit 15 renterias 16 Accounts Payable 17 Net Worn Capital 12 19 Capital Expeditures 1553 12242 14172 -383 1/47 12.647 12.996 1.399 1,765 13,205 13.316 1.455 1.810 1867 1.942 21 EBITDA- CFX-Increase in NWC 4.243 zole 4.051 2.27 4.06 2.214 23 ASSUMPTIONS 24 Sales Growth 23 Membership of sales 26 27 COGS X of Sales 29 Depreciat on't of Sales 30 YRA Sales 3. 32 88.00 10 100: 88.00 LUTA 10.0: 34 Az Oriol Sales 3 vntory of COGS 36 Accounts Payable of COGS 1.0: 35% 8.704 1.0 TS 8.53% 3.79 Cap. Frums of sales 1.1.1 1.115 39 42 44 19 LE 43 Sheet1 + + SAK
Step by Step Solution
There are 3 Steps involved in it

Get step-by-step solutions from verified subject matter experts