

Question: You will need to access the Test II material on the Study Guide. Look at the Log GDP per capita figure in the Theoretical Paths
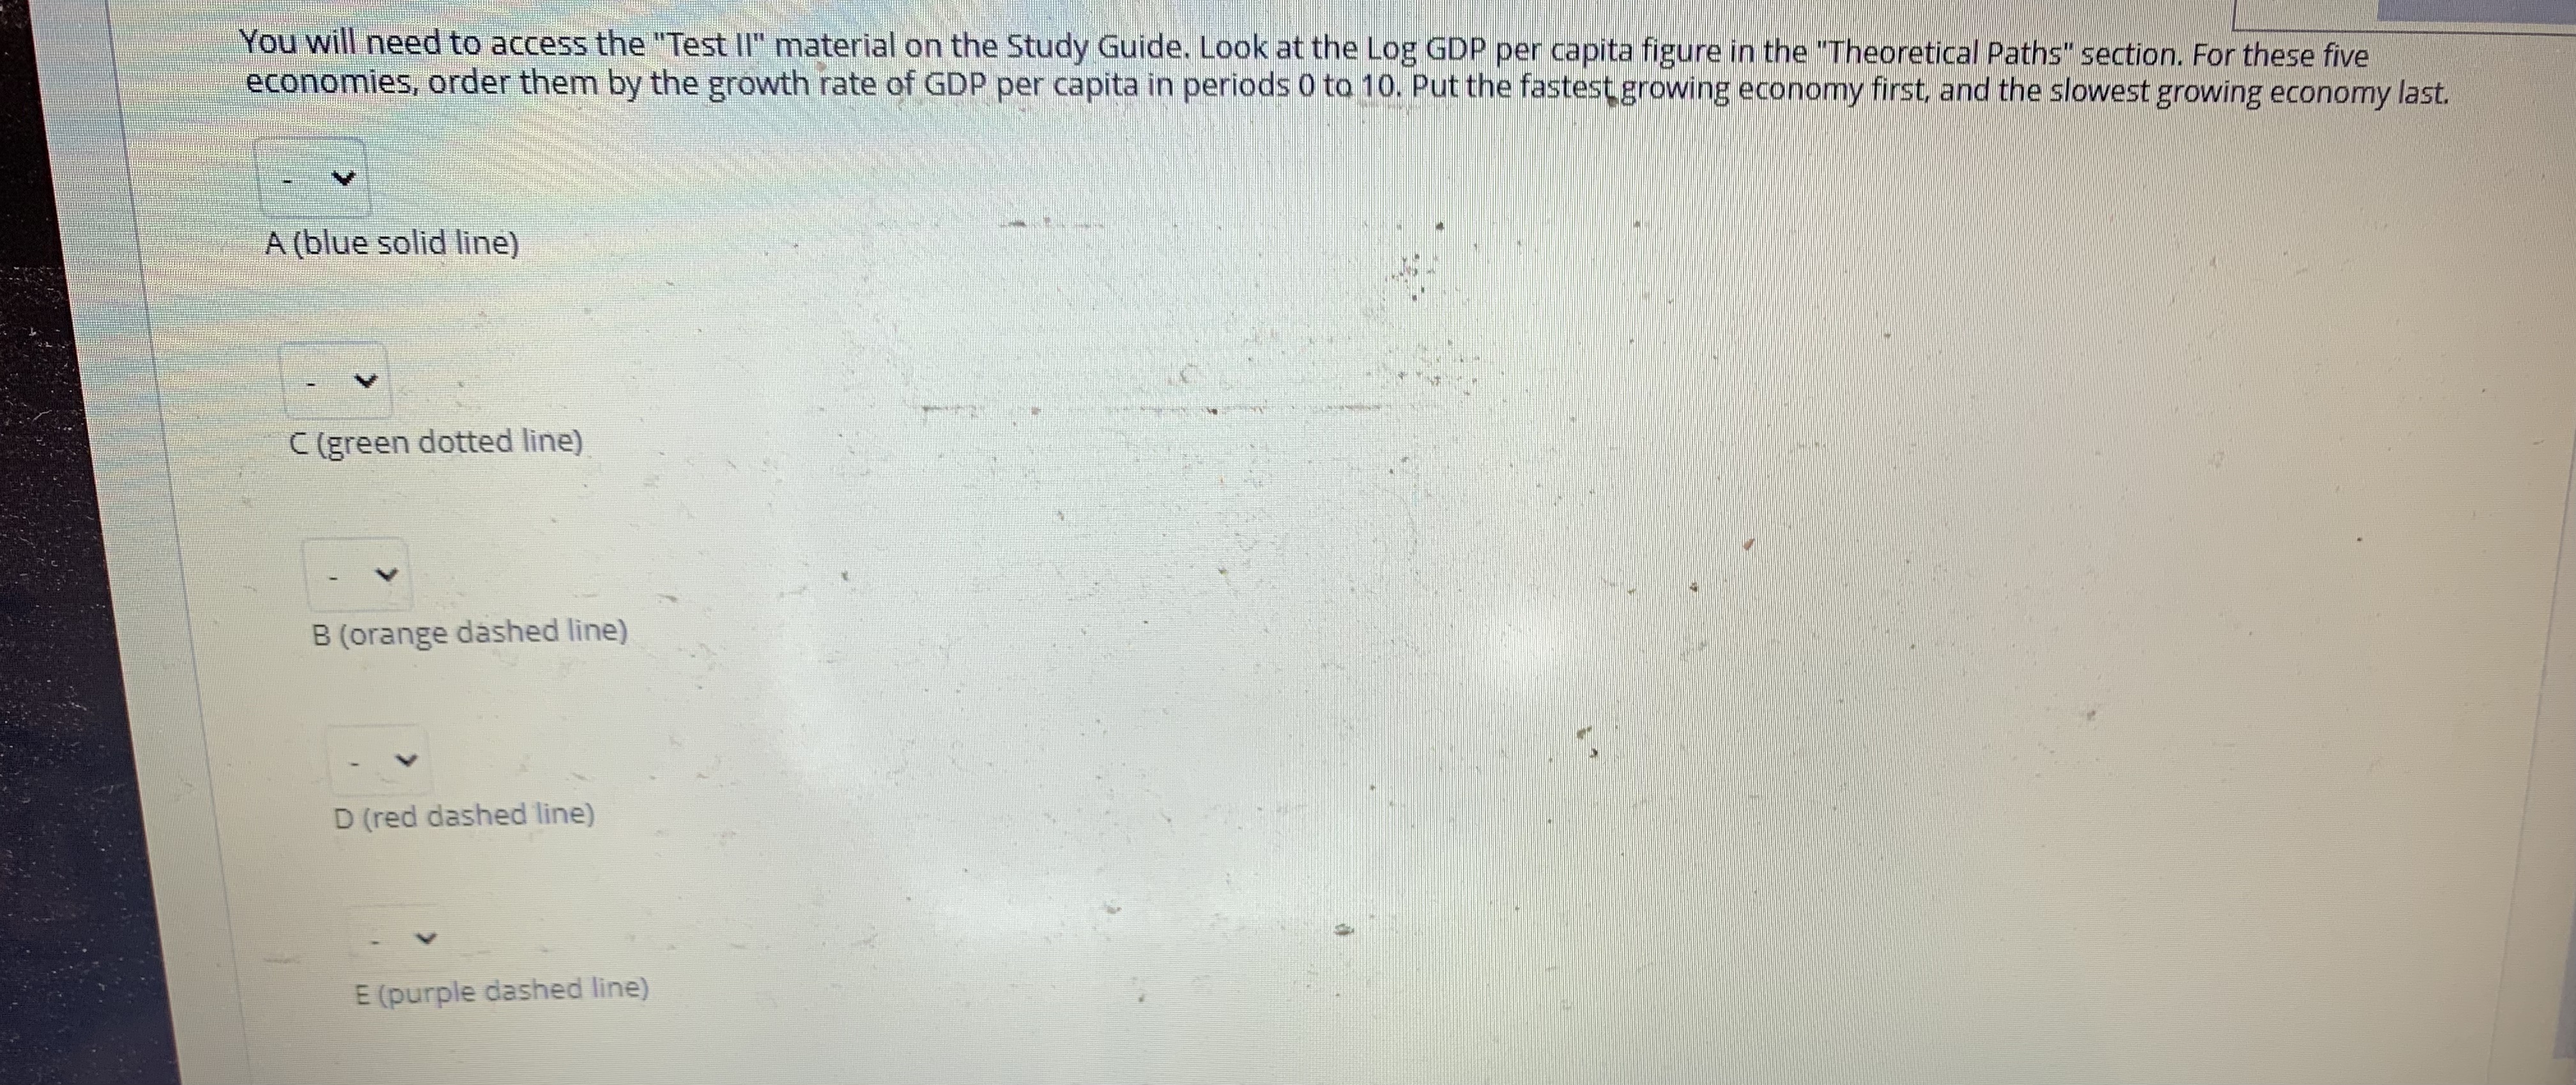
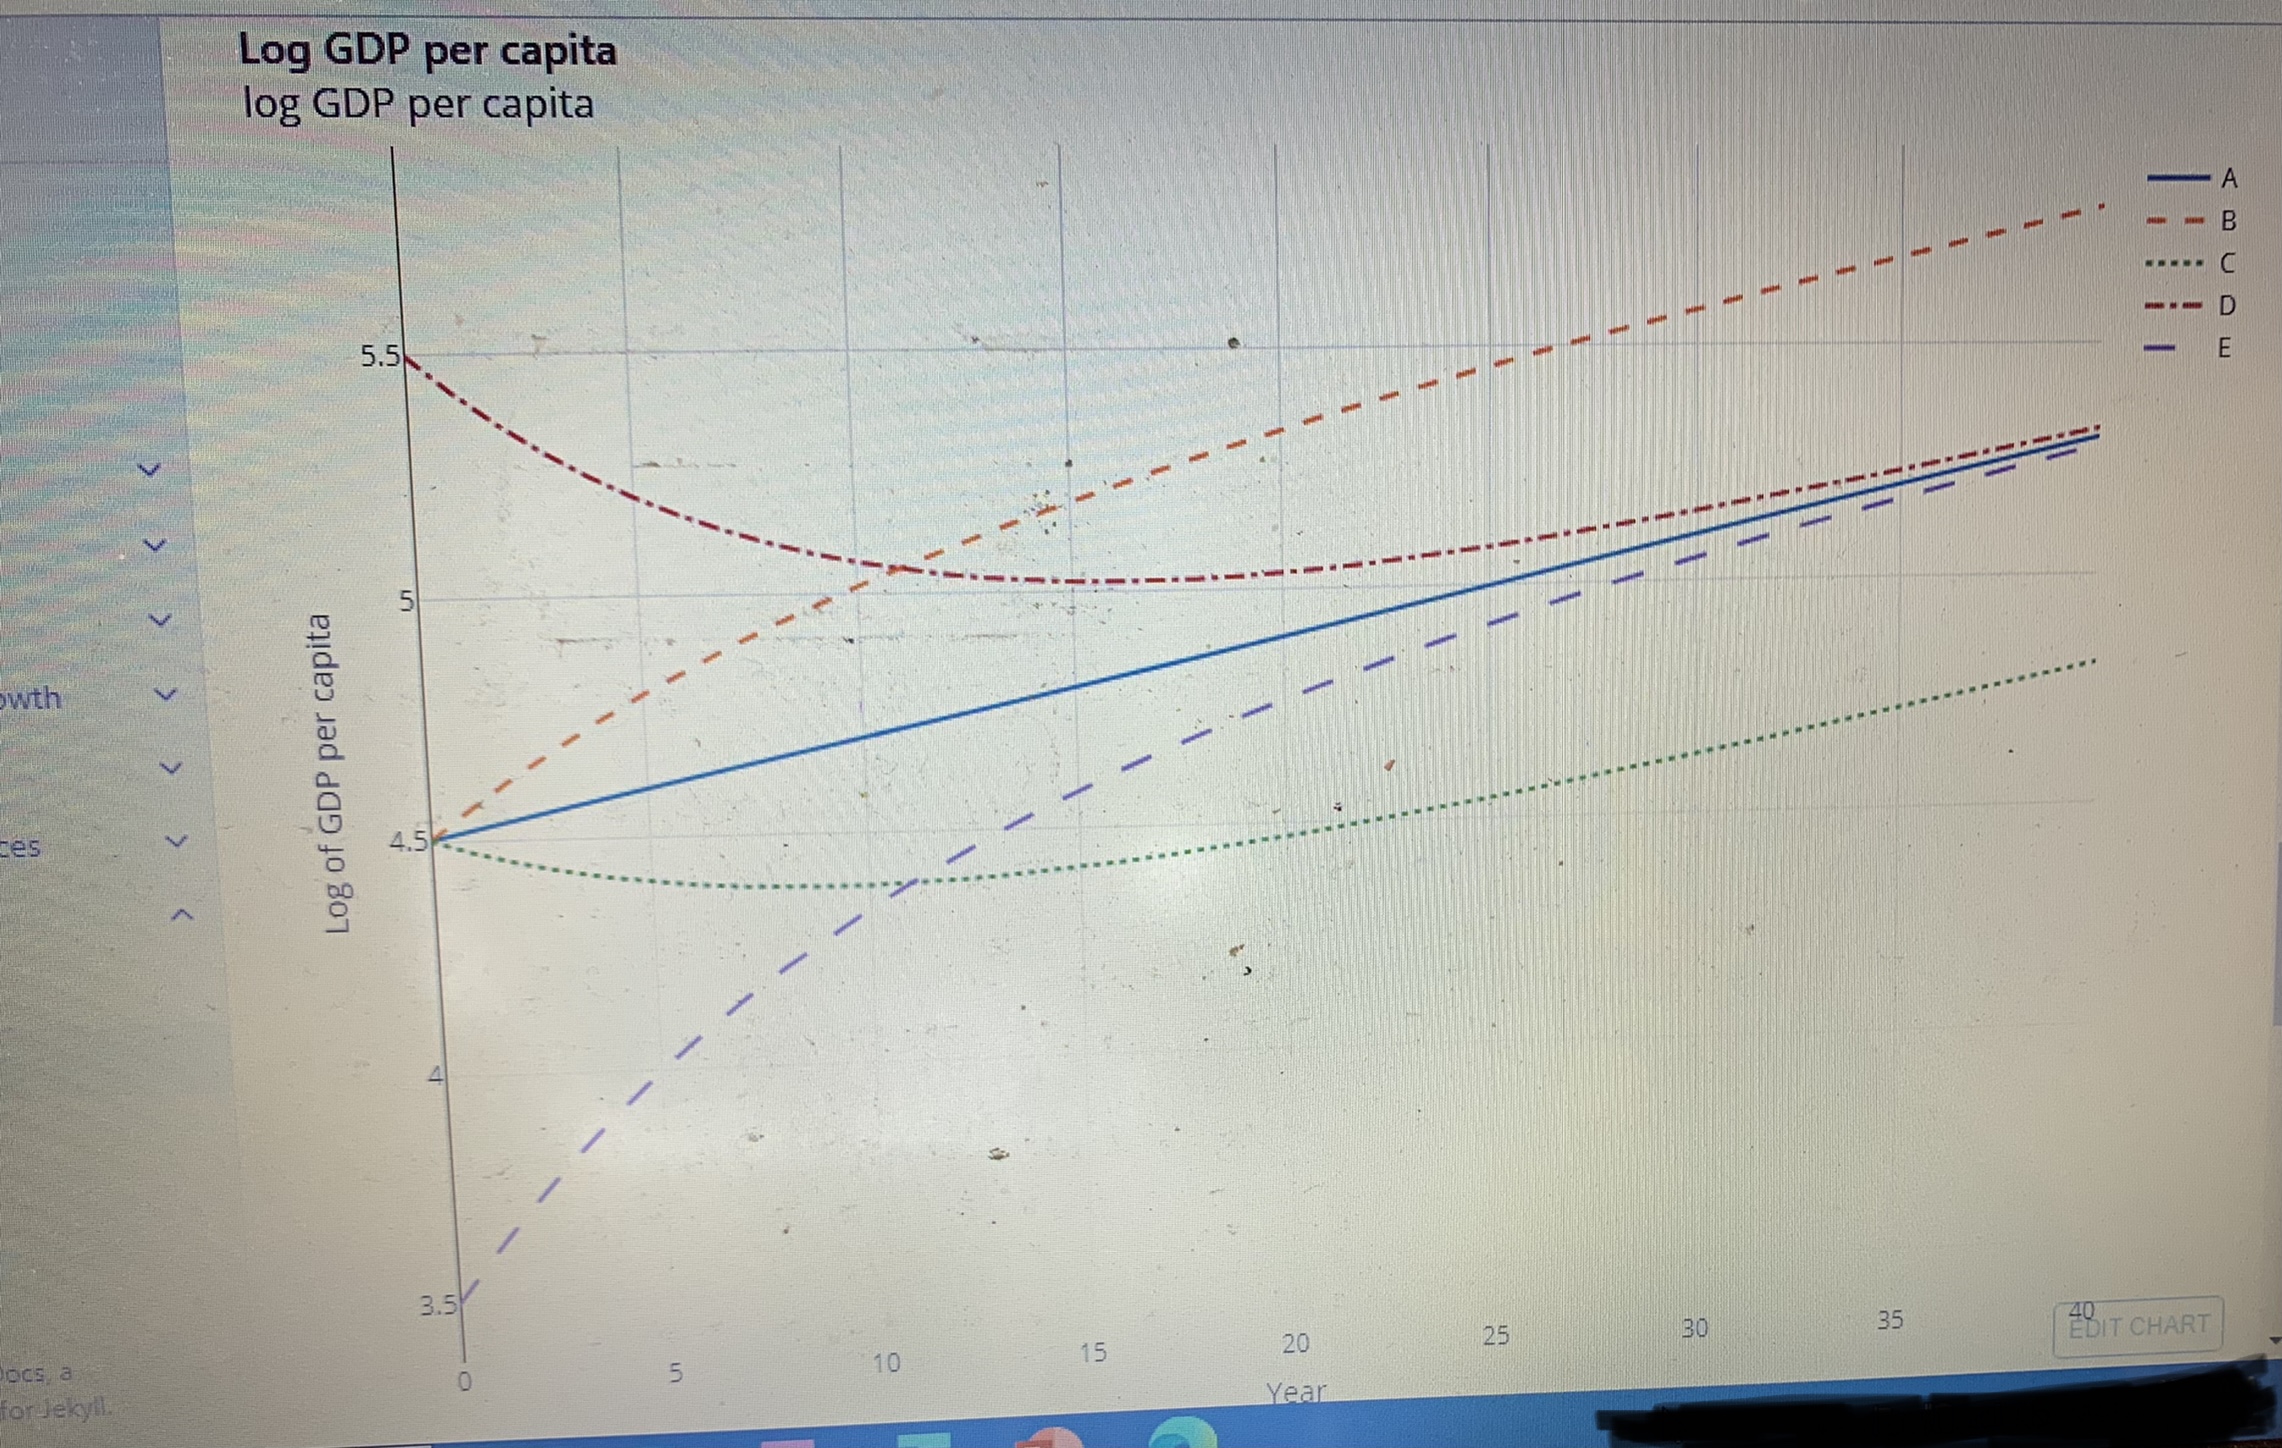


You will need to access the "Test II" material on the Study Guide. Look at the Log GDP per capita figure in the "Theoretical Paths" section. For these five economies, order them by the growth rate of GDP per capita in periods 0 to 10. Put the fastest growing economy first, and the slowest growing economy last. A (blue solid line) C (green dotted line) B (orange dashed line) D (red dashed line) E (purple dashed line)Log GDP per capita log GDP per capita - - 5.56 E
Step by Step Solution
There are 3 Steps involved in it
1 Expert Approved Answer
Step: 1 Unlock

Question Has Been Solved by an Expert!
Get step-by-step solutions from verified subject matter experts
Step: 2 Unlock
Step: 3 Unlock