

Question: You will use the major forecasting techniques learned in this course to build the forecasting models for your revenue data. Please answer the questions below

You will use the major forecasting techniques learned in this course to build the forecasting models for your revenue data.
Please answer the questions below based on the picture I attached and the Date/Revenue chart.
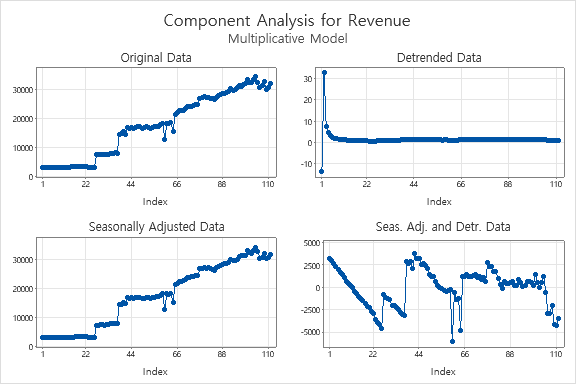
Run a decomposition using the revenue data.
a.State whether you used the additive or the multiplicative model and the reasoning.
b.Run the model and make sure to store the residuals.
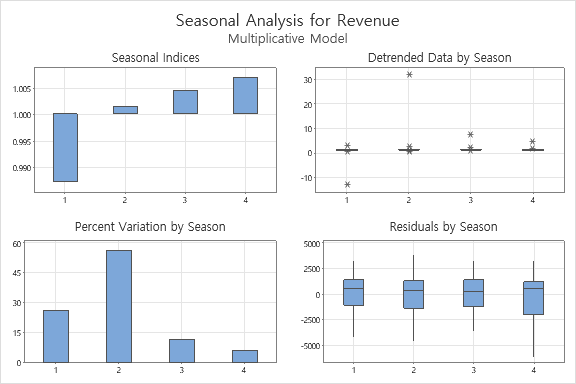
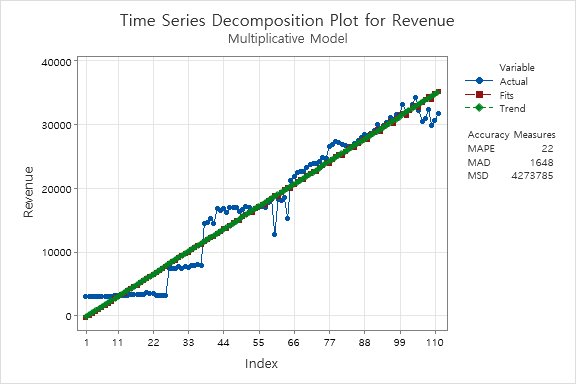
c.Show the Fitted Trend Equation, Seasonal Indices, and Accuracy Measures. Discuss if a linear trend is appropriate and if there is any seasonality according to the seasonal indices.
d.If seasonality is observed, state which seasons are high seasons and which are low seasons. According to the nature of the business, does it make sense? Why?
e.Obtain the ACF of the residuals and show the resulting graph. Explain what you
see. Do you observe any significant autocorrelation? Do you think the model is good?

Component Analysis for Revenue Multiplicative Model Original Data Detrended Data 30 30000 20 20000 10 10000 -10 22 44 66 110 22 44 66 110 Index Index Seasonally Adjusted Data Seas. Adj. and Detr. Data 5000 30000 20000 -2500 10000 -5000 22 44 66 110 22 44 66 110 Index IndexSeasonal Analysis for Revenue Multiplicative Model Seasonal Indices Detrended Data by Season 30 # 1.005 20 1.000 10 0.995 # # 0.990 -10 4 4 Percent Variation by Season Residuals by Season 5000 45 2500 30 -2500 15 -5000 4 4Time Series Decomposition Plot for Revenue Multiplicative Model 40000 Variable Actual Fits Trend 30000 Accuracy Measures MAPE 22 MAD 1648 MSD 4273785 Revenue 20000 10000 1 11 22 33 44 55 66 77 88 99 110 Index
Step by Step Solution
There are 3 Steps involved in it

Get step-by-step solutions from verified subject matter experts