

Question: You will use the queuing templates demonstrated in the lesson commentary to complete this assignment. The basic models template provided in the Commentary is linked
You will use the queuing templates demonstrated in the lesson commentary to complete this assignment. The basic models template provided in the Commentary is linked below.
- Many of a bank's customers use its automatic teller machine to transact business after normal banking hours. During the early evening hours in the summer months, customers arrive at a certain location at the rate of one every other minute. This can be modeled using a Poisson distribution. Each customer spends an average of 90 seconds completing his or her transactions. Transaction time is exponentially distributed. Determine:
- The average time customers spend at the machine, including waiting in line and completing transactions.
- The probability that a customer will not have to wait upon arriving at the automatic teller machine.
- The average number waiting to use the machine.
- Extend your analysis of the ATM machine queuing system (from the problem above) as follows: The original problem had an arrival on average "one every other minute", i.e. on average 120 seconds apart. Evaluate the system characteristics for the following time between arrivals in seconds: 240, 180, 120, 110, 100, 95, 93, 92, 91.5, 91. Why can't we evaluate the system with arrivals on average 90 seconds apart? What would happen to the long run average queue time if the time between arrivals was less than 90 seconds? Create a chart that plots the average time in queue (on the vertical axis) vs. the server utilization on the horizontal axis. Interpret this chart. (Note: The time between arrivals values, and the utilization values that result from them, are not evenly spaced. Do not plot them as evenly spaced on your chart. You will need to use a "scatterplot" type of chart ("with lines and markers" option) in Excel, You should copy and paste your chart into a Word document containing your answers. Do not simply post an Excel spreadsheet.
- A local utility has a customer service call center that takes 3 types of calls: (1) Billing inquiries (2) Requests for change of service, and (3) Technical problems. During the busiest time of day, they receive on average 25 calls per hour for billing inquiries, 50 calls per hour for change of service, and 2.5 calls per hour dealing with technical problems. The number of calls per hour of each type has Poisson distribution, which implies the time between calls of each type has exponential distribution.
The service time for each type of call has exponential distribution, with the following average time per call:
- Billing inquiries: 3 minutes
- Service change: 3 minutes
- Technical problems: 15 minutes
Use the Excel template to analyze the utilization and queuing characteristics of the three systems, if there are 2 servers available to take billing inquiry calls, 4 servers available to take service change calls, and 1 server available to take technical problem calls. Create a table that summarizes the results and allows for comparison of the three systems. How does the server utilization compare across the three systems? Which system has the highest average queue time? Which has the smallest? Why?
Suppose the 2 billing inquiry reps and the 4 service change reps could be cross-trained, so that any of the 6 servers could answer either type of call. The average time per call is still 3 minutes for both call types, and the two call types would have a combined arrival rate of 75 calls per hour. The total number of calls per hour still has Poisson distribution. How does the average queue time in this combined system compare to the situation where different servers could only answer one type of call? Why?
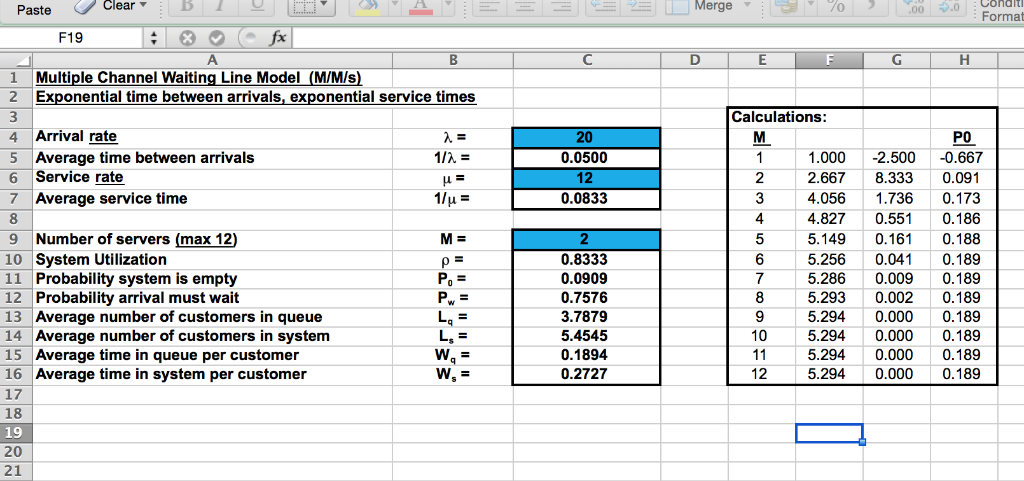
Paste Clear 10 Merge .00 .0 : Conditi Format F19 A C D E F G Calculations: Multiple Channel Waiting Line Model (M/M/s) 2 Exponential time between arrivals, exponential service times 3 4 Arrival rate 2. = 5 Average time between arrivals 1/2 = 6 Service rate u= 7 Average service time 1/u = 20 1 0.0500 12 0.0833 8 M = p= P = 9 Number of servers (max 12) 10 System Utilization 11 Probability system is empty 12 Probability arrival must wait 13 Average number of customers in queue 14 Average number of customers in system 15 Average time in queue per customer 16 Average time in system per customer 17 2 0.8333 0.0909 0.7576 3.7879 5.4545 0.1894 0.2727 DOWN- 1.000 2.667 4.056 4.827 5.149 5.256 5.286 5.293 5.294 5.294 5.294 5.294 2.500 8.333 1.736 0.551 0.161 0.041 0.009 0.002 0.000 0.000 0.000 0.000 PO -0.667 0.091 0.173 0.186 0.188 0.189 0.189 0.189 0.189 0.189 0.189 0.189 W, = W = 12 18 19 20 21 Paste Clear 10 Merge .00 .0 : Conditi Format F19 A C D E F G Calculations: Multiple Channel Waiting Line Model (M/M/s) 2 Exponential time between arrivals, exponential service times 3 4 Arrival rate 2. = 5 Average time between arrivals 1/2 = 6 Service rate u= 7 Average service time 1/u = 20 1 0.0500 12 0.0833 8 M = p= P = 9 Number of servers (max 12) 10 System Utilization 11 Probability system is empty 12 Probability arrival must wait 13 Average number of customers in queue 14 Average number of customers in system 15 Average time in queue per customer 16 Average time in system per customer 17 2 0.8333 0.0909 0.7576 3.7879 5.4545 0.1894 0.2727 DOWN- 1.000 2.667 4.056 4.827 5.149 5.256 5.286 5.293 5.294 5.294 5.294 5.294 2.500 8.333 1.736 0.551 0.161 0.041 0.009 0.002 0.000 0.000 0.000 0.000 PO -0.667 0.091 0.173 0.186 0.188 0.189 0.189 0.189 0.189 0.189 0.189 0.189 W, = W = 12 18 19 20 21
Step by Step Solution
There are 3 Steps involved in it

Get step-by-step solutions from verified subject matter experts