

Question: you will write an R script to calculate the relative volatility for the three given stocks: enb, baba, and aapl the following are names of
you will write an R script to calculate the relative volatility for the three given stocks: enb, baba, and aapl
the following are names of files : "BABA.csv "AAPL.csv "ENB.csv
These CSV files contain the historical trading data for the corresponding stocks trading
atNYSENasdaq stock exchange, and each of them has the following information:
Date, Open Price, High Price, Low Price, Close Price, Adj Close, Volume
Your task is to write an R script that will calculate the covariance for each of the stocks to calculatethe volatility for the year using the closing price of the stocks. A higher value of covariancemeans the stock is more volatile.
How to calculate covariance?
To calculate the covariance, we need to know the mean and the standard deviation sd Then using the mean and the standard deviation, we can calculate the covariance cv using the following formula: cv sdmean
To DO:
Your R script should deliver the following:
The script should save the covariance for each of the three stocks to a data frame, and then the data frame should be saved to a CSV file named "covariance.csv
All the covariances of the three stocks should be plotted on a single plot
Your program should save the stock tickers for the most and the least volatile stocks to a data frame, and then the data frame should be saved to another CSV file named "maxMin.csv
Make sure the script is well documented.
Important Notes:
Make sure that you show and everystep for exmaple where is project is being saved and ouput for each questions aksed above.Make sure that code runs propely I am also leaving a sample exmaple to that illustrates the output for all the question. note that in the sample example thery are using five stocks where as we are only focusing on stocks which are "baba", "enb", "aapl". The sample doesn;t use the same stocks it just to demontrates the outputs of the questions asked above.
Hope anyone doing this question is clear and Thanks in advance
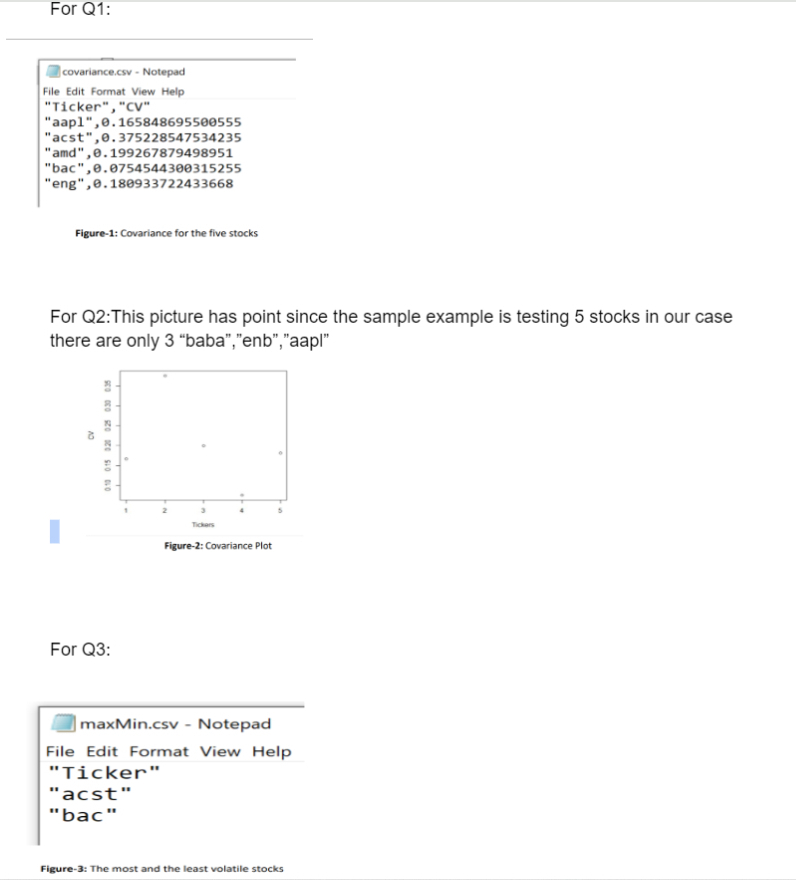
For Q:
Figure: Covariance for the five stocks
For Q:This picture has point since the sample example is testing stocks in our case
there are only "baba","enb","aapl"
For Q:
maxMin.csv Notepad
File Edit Format View Help
"Ticker"
"acst"
"bac"
Figure: The most and the least volatile stocks
Step by Step Solution
There are 3 Steps involved in it
1 Expert Approved Answer
Step: 1 Unlock

Question Has Been Solved by an Expert!
Get step-by-step solutions from verified subject matter experts
Step: 2 Unlock
Step: 3 Unlock