

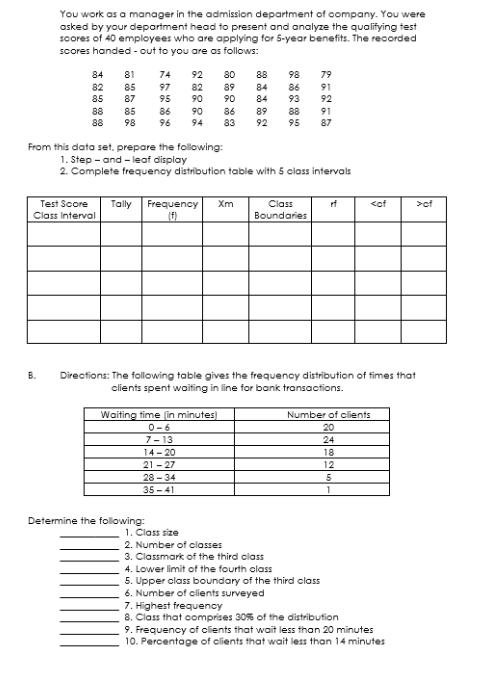
You work as a manager in the admission department of company. You were asked by your...
Fantastic news! We've Found the answer you've been seeking!
Question:
Expert Answer:
A 1 Step and leaf display 74 1 79 2 80 1 81 1 82 2 84 3 85 2 86 2 87 1 88 4 89 2 90 3 91 ... View the full answer

Related Book For 
Intermediate Accounting IFRS
ISBN: 978-1119372936
3rd edition
Authors: Donald E. Kieso, Jerry J. Weygandt, Terry D. Warfield
Posted Date:
