

Question: You'll create a Financial Health Snapshot, conduct basic analysis using pivot tables, and build a simple 3 - month projection based on sample data. You
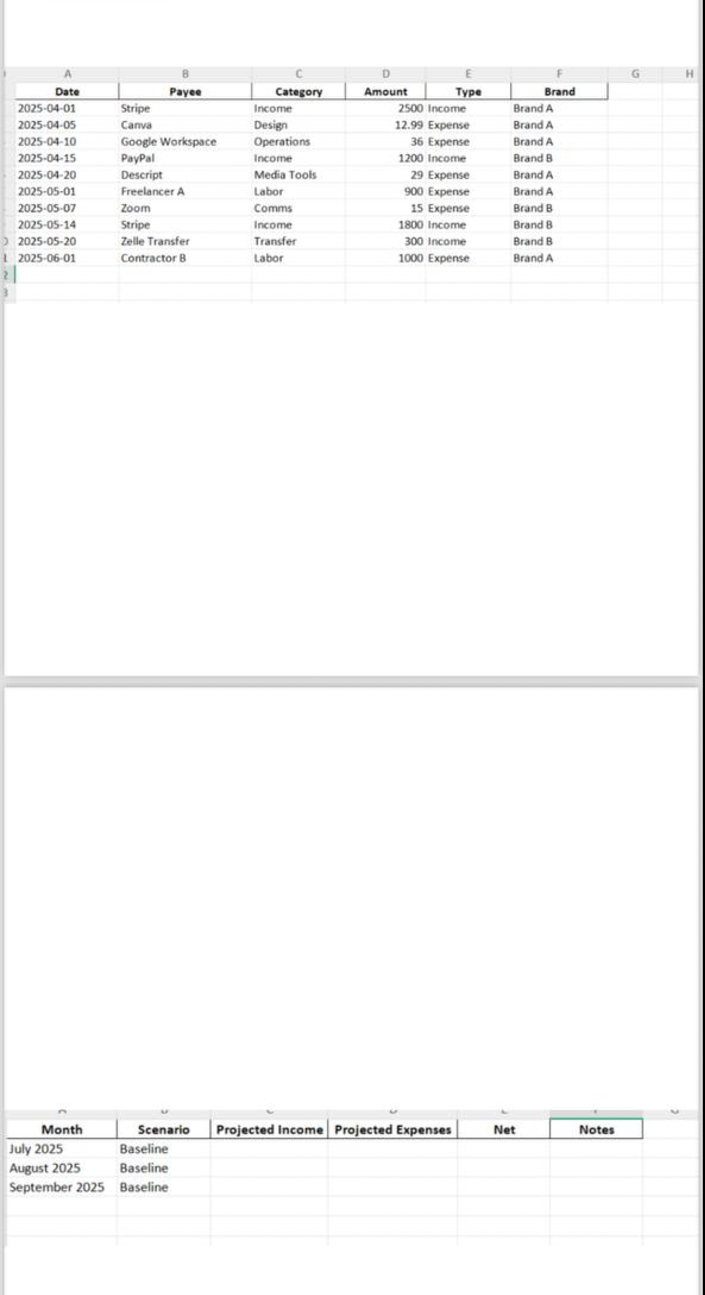
You'll create a Financial Health Snapshot, conduct basic analysis using pivot tables, and build a simple month projection based on sample data. Youll also complete a short tool familiarity checklist to help us understand your preferred systems. Timeline Submission: Google Sheet or Excel page PDF summary What Youll Do Part : Financial Snapshot Pivot Table Analysis Use the data provided to: Build pivot tables to group expenses by category and month Create a clear visual dashboard charts or graphs welcome Identify major spend areas and summarize your findings A c D E F G H Date Payee Category Amount Type Brand Stripe Income Income Brand A Canva Design Expense Brand A Google Workspace Operations Expense Brand A PayPal Income Income Brand B Descript Media Tools Expense Brand A Freelancer A Labor Expense Brand A Zoom Comms Expense Brand B Stripe Income Income Brand Zelle Transfer Transfer Income Brand B t Contractor B Labor Expense Brand A Month Scenario Projected Income Projected Expenses Net Notes July Baseline August Baseline September Baseline
Step by Step Solution
There are 3 Steps involved in it
1 Expert Approved Answer
Step: 1 Unlock

Question Has Been Solved by an Expert!
Get step-by-step solutions from verified subject matter experts
Step: 2 Unlock
Step: 3 Unlock