

Question: Your answer is incorrect. Calculate the relevant sample statistic. Enter the exact answer. Sample statistic = ! eTextbook and Media Hint Assistance Used Determine the

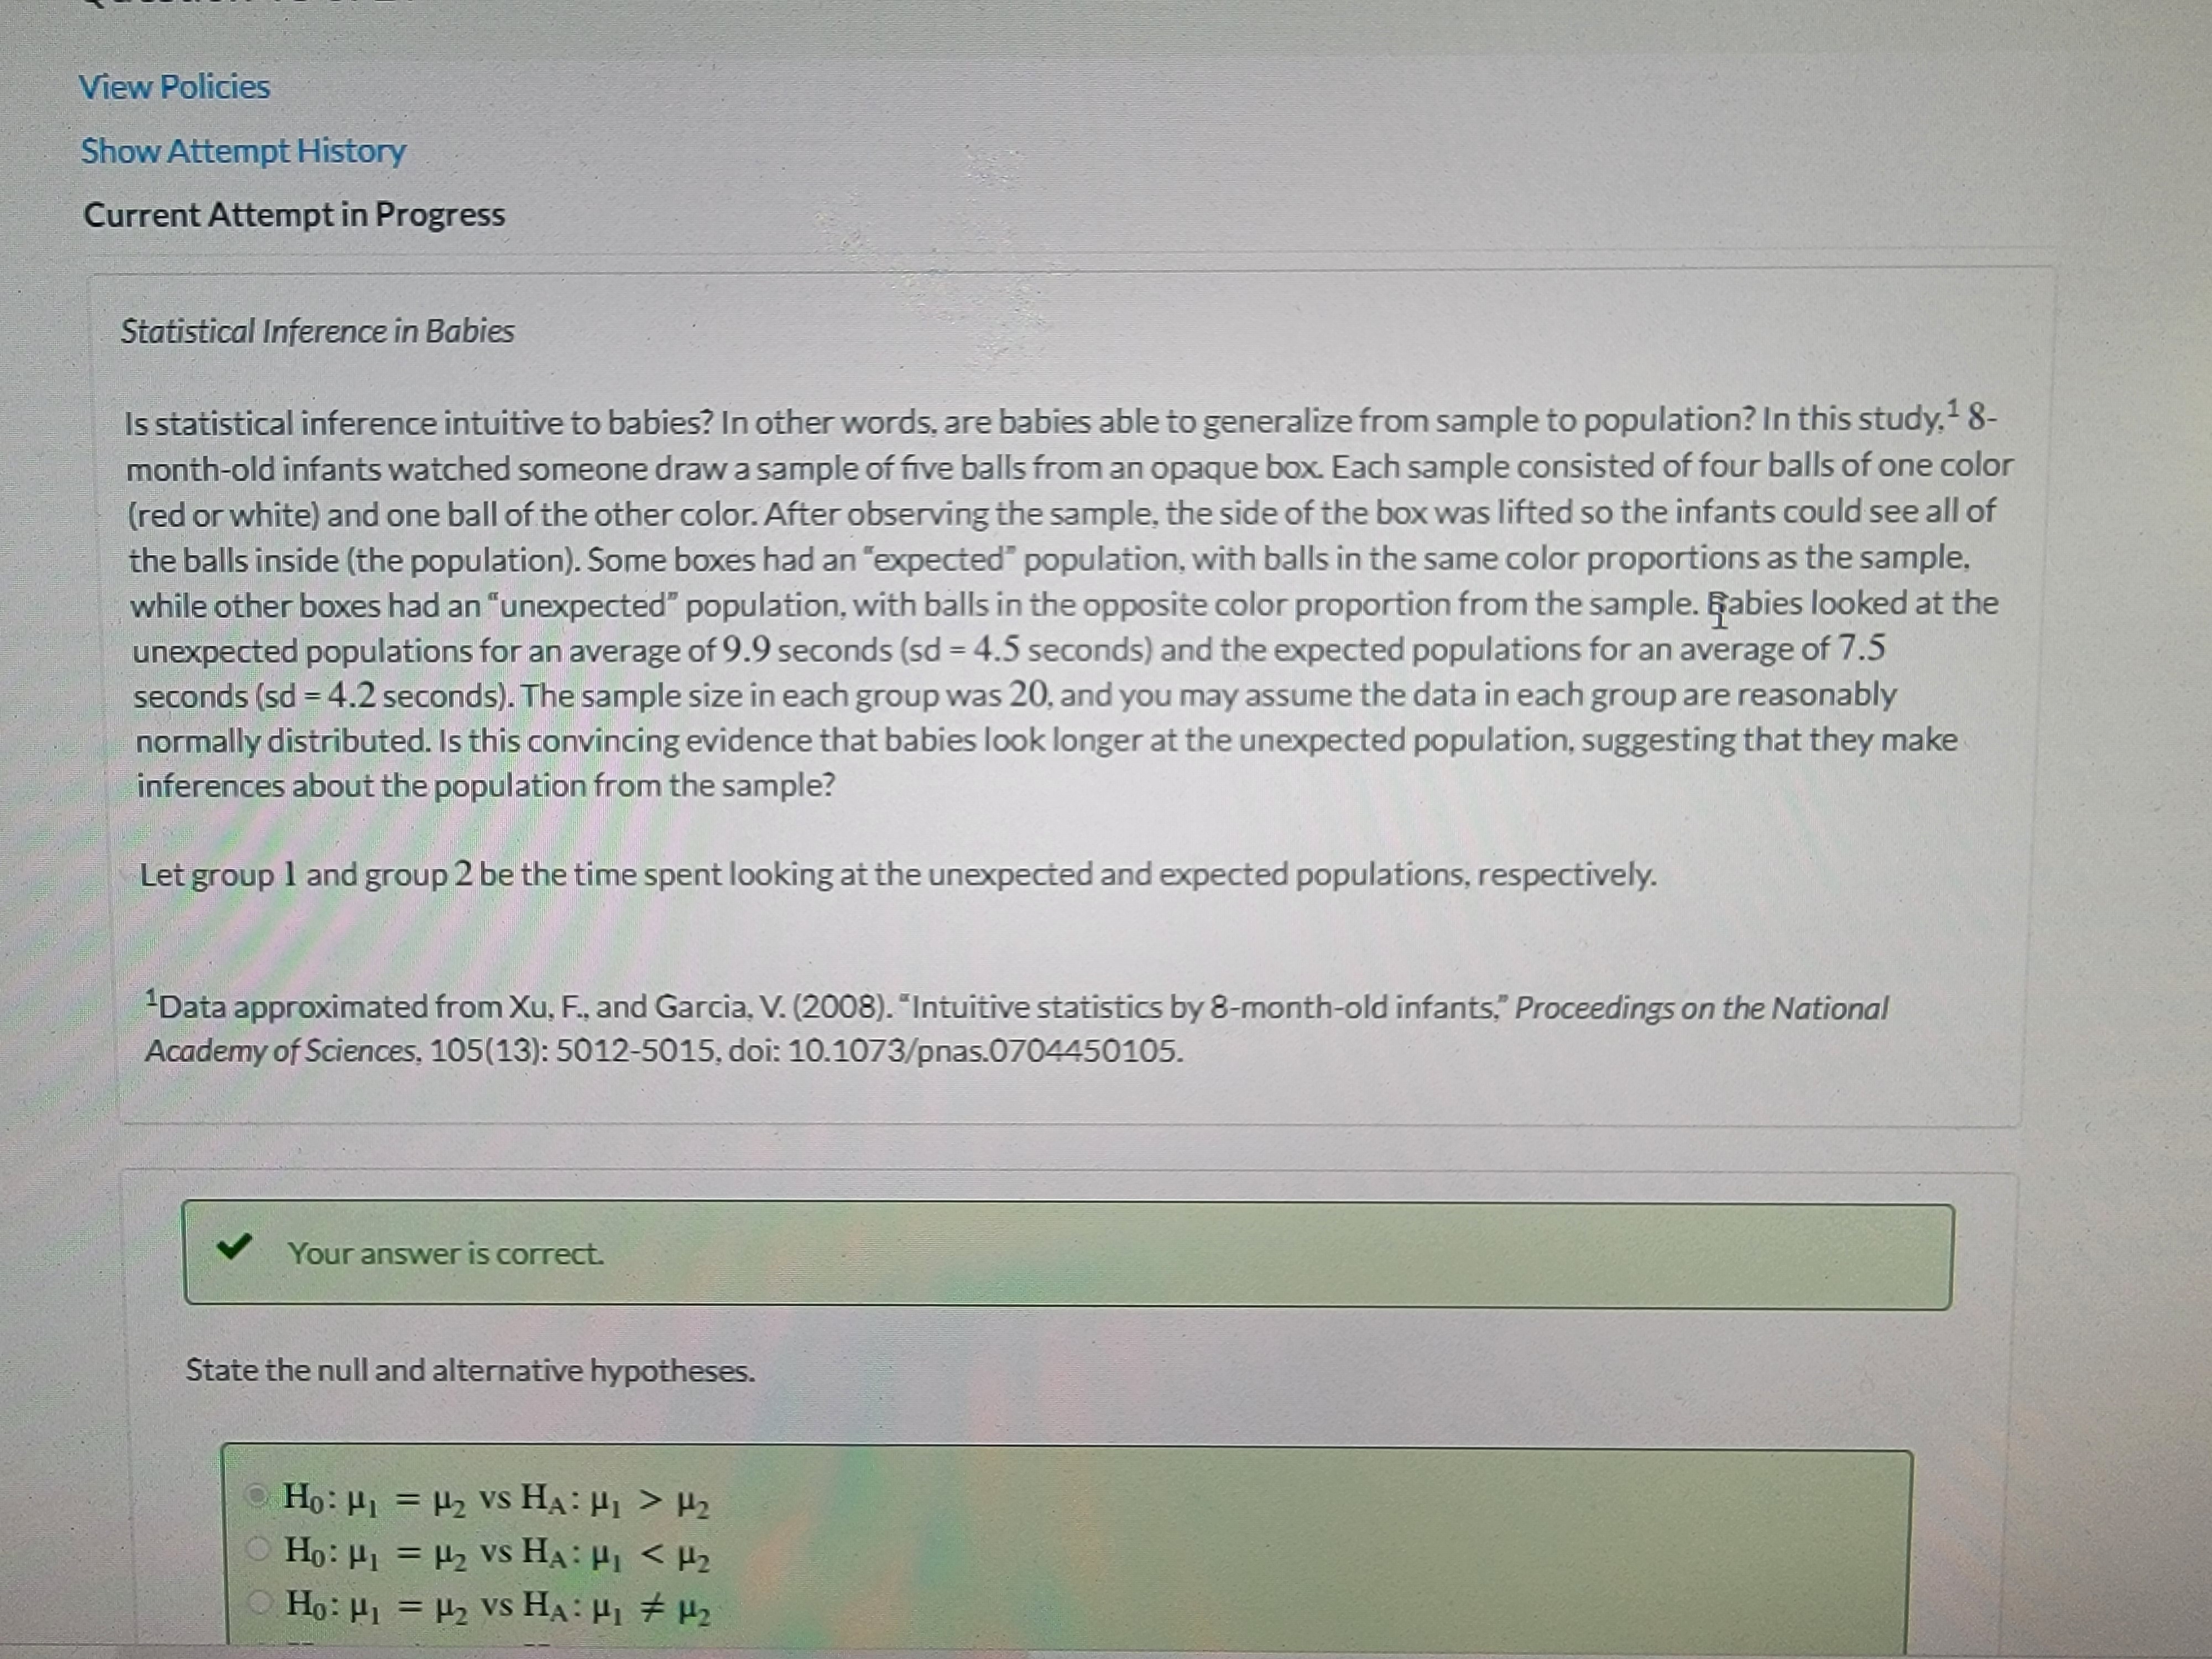
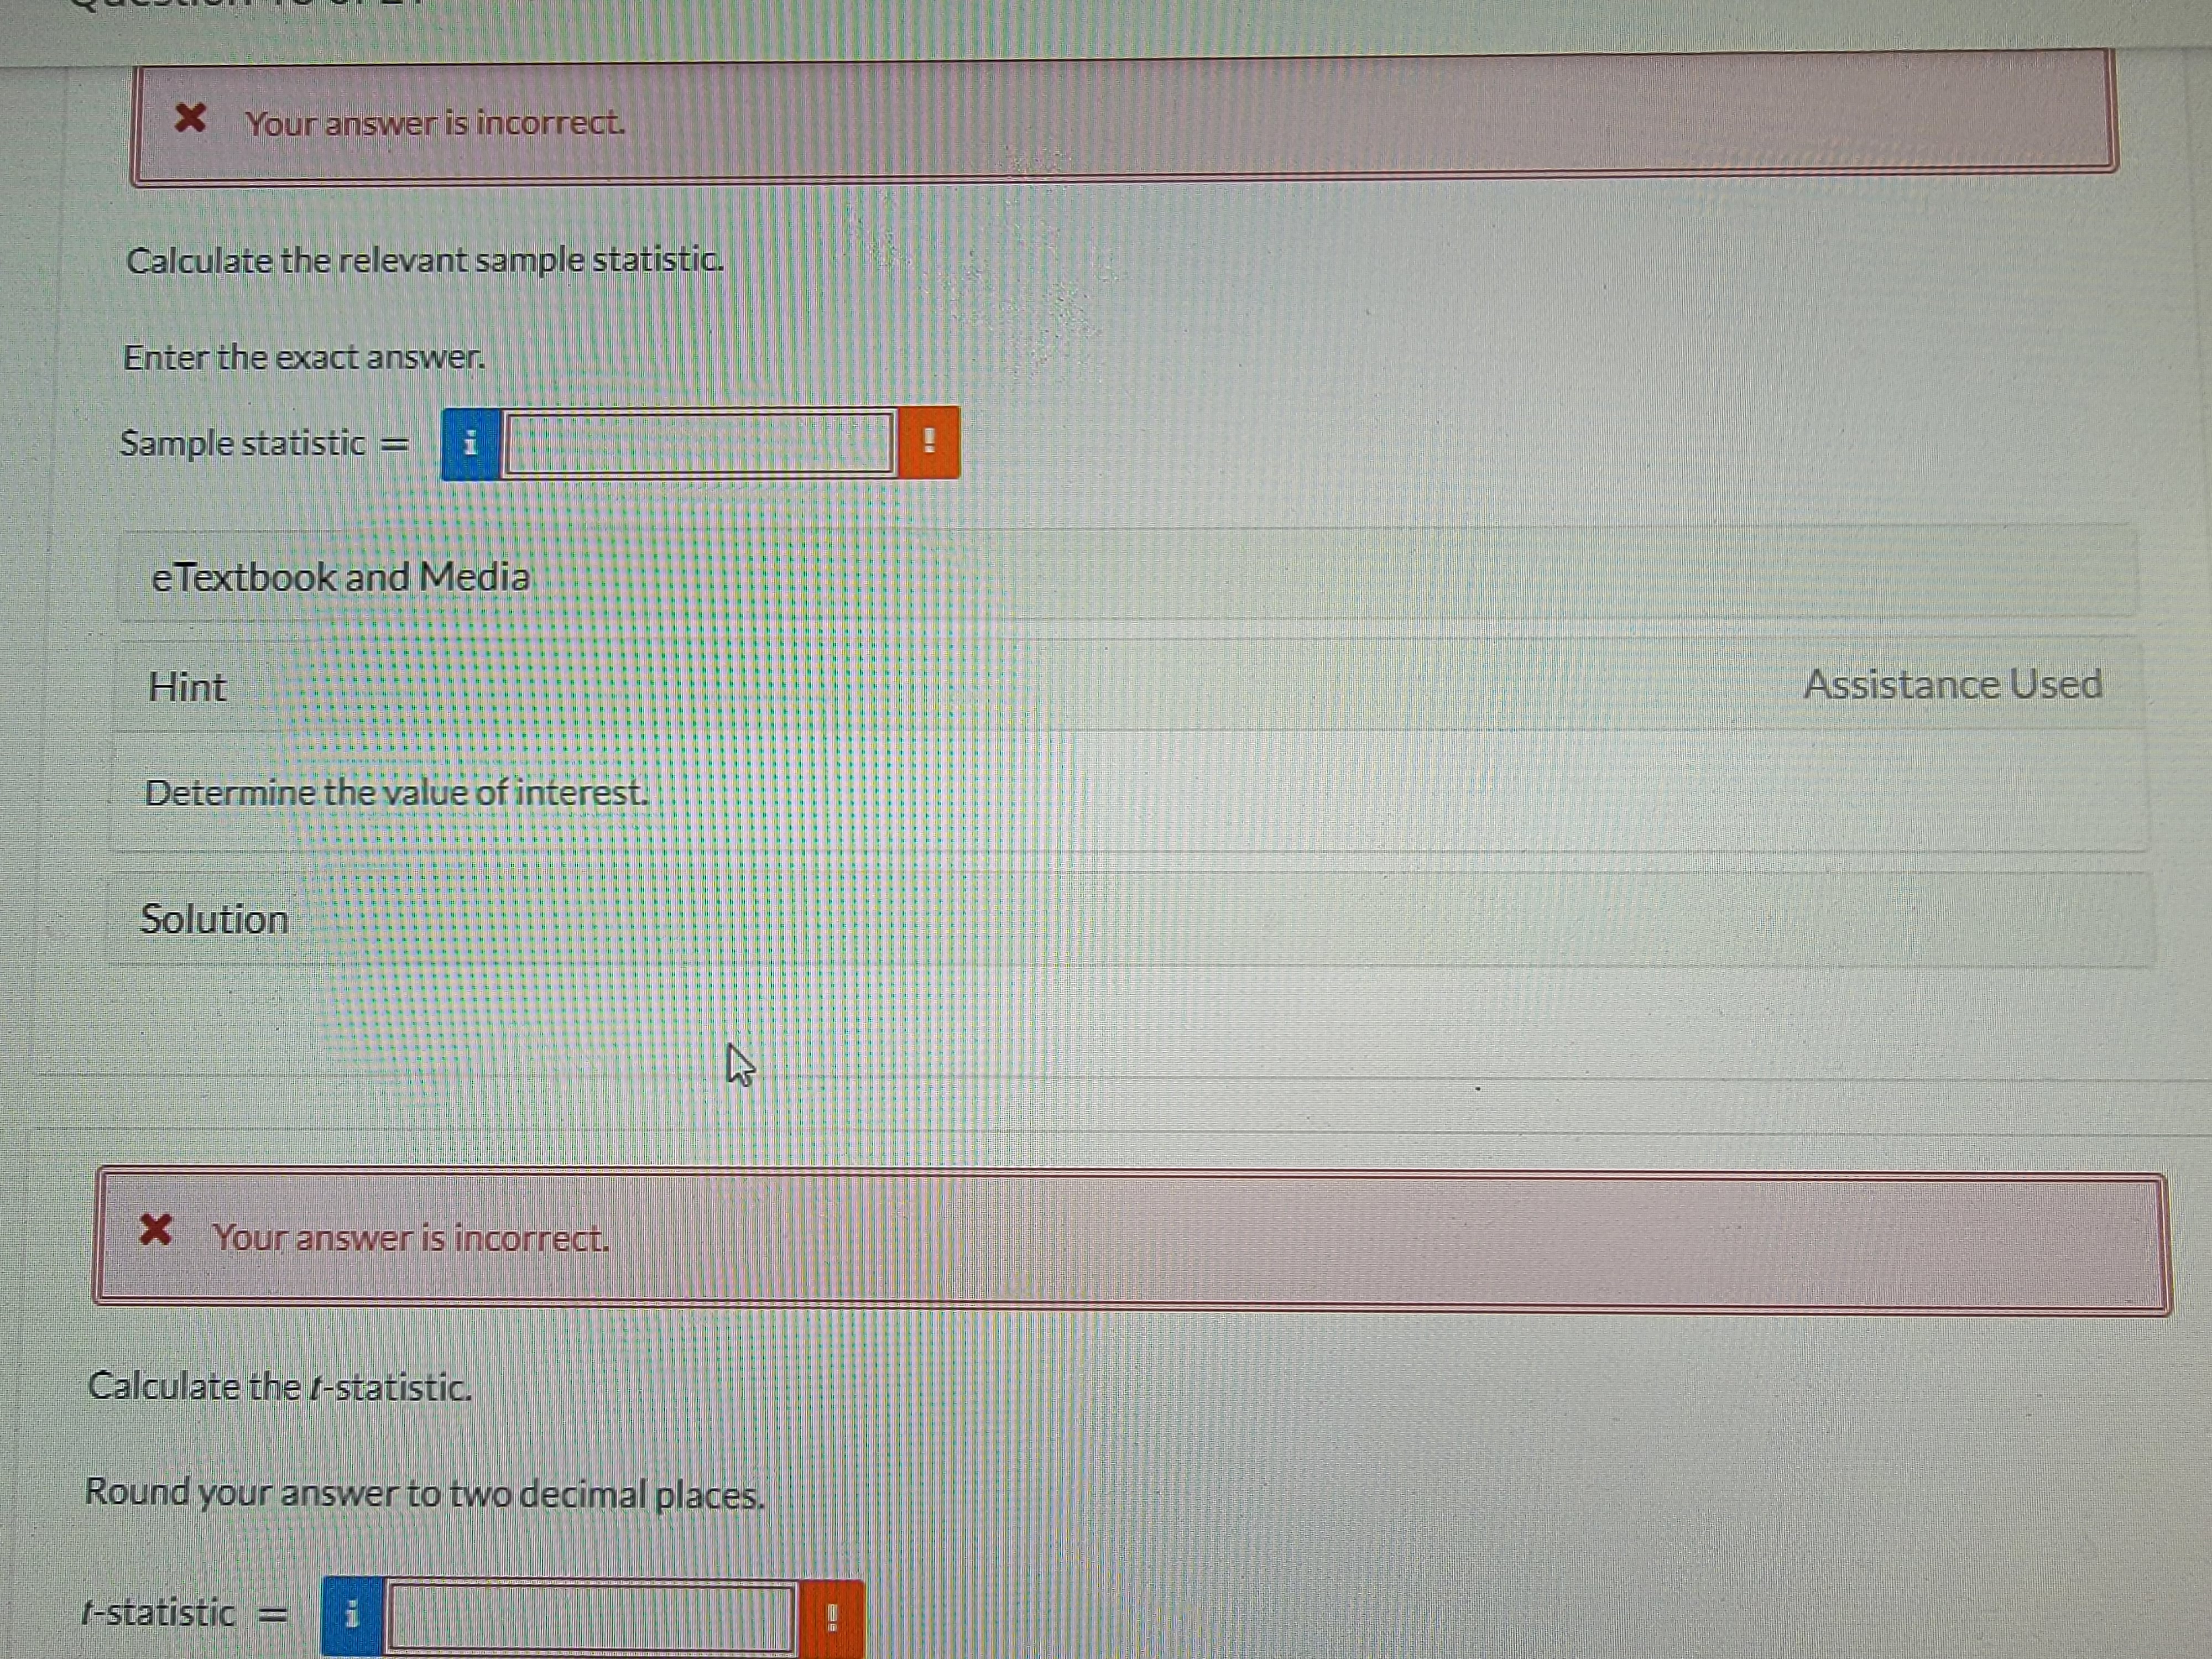


Your answer is incorrect. Calculate the relevant sample statistic. Enter the exact answer. Sample statistic = ! eTextbook and Media Hint Assistance Used Determine the value of interest. Solution X Your answer is incorrect. Calculate the /-statistic. Round your answer to two decimal places. f-statistic i !X Your answer is incorrect. Find the p-value. Round your answer to three decimal places. p-value = ! e Textbook and Media Hint Solution Your answer is correct. Make a generic conclusion about the null hypothesis, using a = 0.10. Reject Ho- Do not reject Ho- e Textbook and Media zPulse10.csv HomesForSaleCant..CSV 20210712_194541.jpg 20210712_190604.jpgView Policies Show Attempt History Current Attempt in Progress Statistical Inference in Babies Is statistical inference intuitive to babies? In other words, are babies able to generalize from sample to population? In this study, 1 8- month-old infants watched someone draw a sample of five balls from an opaque box. Each sample consisted of four balls of one color (red or white) and one ball of the other color. After observing the sample, the side of the box was lifted so the infants could see all of the balls inside (the population). Some boxes had an "expected" population, with balls in the same color proportions as the sample, while other boxes had an "unexpected" population, with balls in the opposite color proportion from the sample. Babies looked at the unexpected populations for an average of 9.9 seconds (sd = 4.5 seconds) and the expected populations for an average of 7.5 seconds (sd = 4.2 seconds). The sample size in each group was 20, and you may assume the data in each group are reasonably normally distributed. Is this convincing evidence that babies look longer at the unexpected population, suggesting that they make inferences about the population from the sample? Let group 1 and group 2 be the time spent looking at the unexpected and expected populations, respectively. Data approximated from Xu, F., and Garcia, V. (2008). "Intuitive statistics by 8-month-old infants," Proceedings on the National Academy of Sciences, 105(13): 5012-5015, doi: 10.1073/pnas.0704450105. Your answer is correct. State the null and alternative hypotheses. Ho: H1 = (2 VS HA : HI > H2 O Ho: H1 = H2 VS HA : HI
Step by Step Solution
There are 3 Steps involved in it

Get step-by-step solutions from verified subject matter experts