

Question: Your answer is partially correct. Here are comparative statement data for Crane Company and Sheridan Company, two competitors. All balance sheet data an December 31,
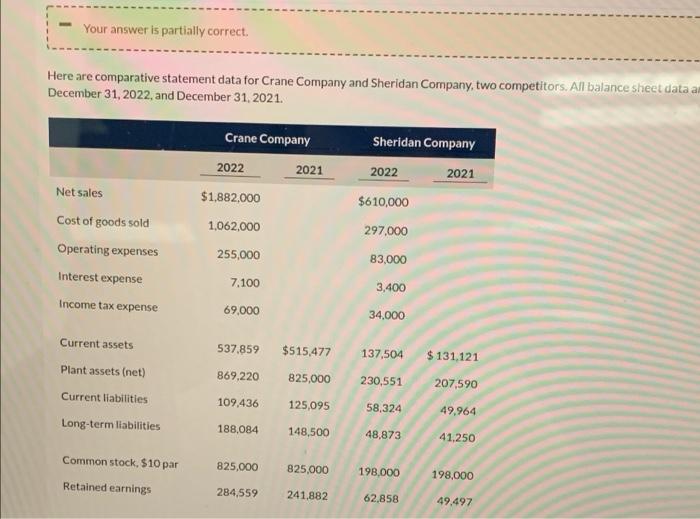
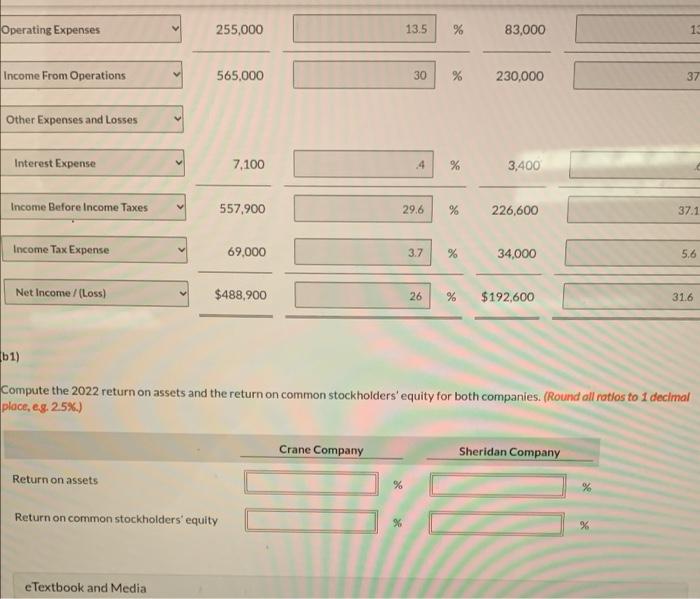
Your answer is partially correct. Here are comparative statement data for Crane Company and Sheridan Company, two competitors. All balance sheet data an December 31, 2022, and December 31, 2021. Sheridan Company Crane Company 2022 2021 2022 2021 Net sales $1,882,000 $610,000 Cost of goods sold 1,062,000 297.000 255,000 83,000 Operating expenses Interest expense Income tax expense 7.100 3,400 69.000 34.000 Current assets 537,859 $515,477 137,504 $ 131,121 Plant assets (net) 869.220 825,000 230,551 207,590 Current liabilities 109,436 125,095 58,324 49,964 Long-term liabilities 188,084 148,500 48,873 41.250 Common stock, $10 par 825,000 825.000 198,000 198,000 Retained earnings 284,559 241.882 62,858 49.497 Operating Expenses 255,000 13.5 % se 83,000 13 Income From Operations 565,000 30 % 230,000 37 Other Expenses and Losses Interest Expense 7,100 4 se % 3,400 Income Before Income Taxes 557.900 29.6 % 226,600 37.1 Income Tax Expense 69,000 3.7 % 34,000 5.6 Net Income /(Loss) $488,900 26 % $192,600 31.6 (61) Compute the 2022 return on assets and the return on common stockholders' equity for both companies. (Round all ratios to 1 decimal place, e.g. 25%.) Crane Company Sheridan Company Return on assets % Return on common stockholders' equity e Textbook and Media
Step by Step Solution
There are 3 Steps involved in it

Get step-by-step solutions from verified subject matter experts