

Question: Your answer is partially correct. The rectangles in the figure have been drawn Edit to approximate (a) Do the rectangles represent a left or a


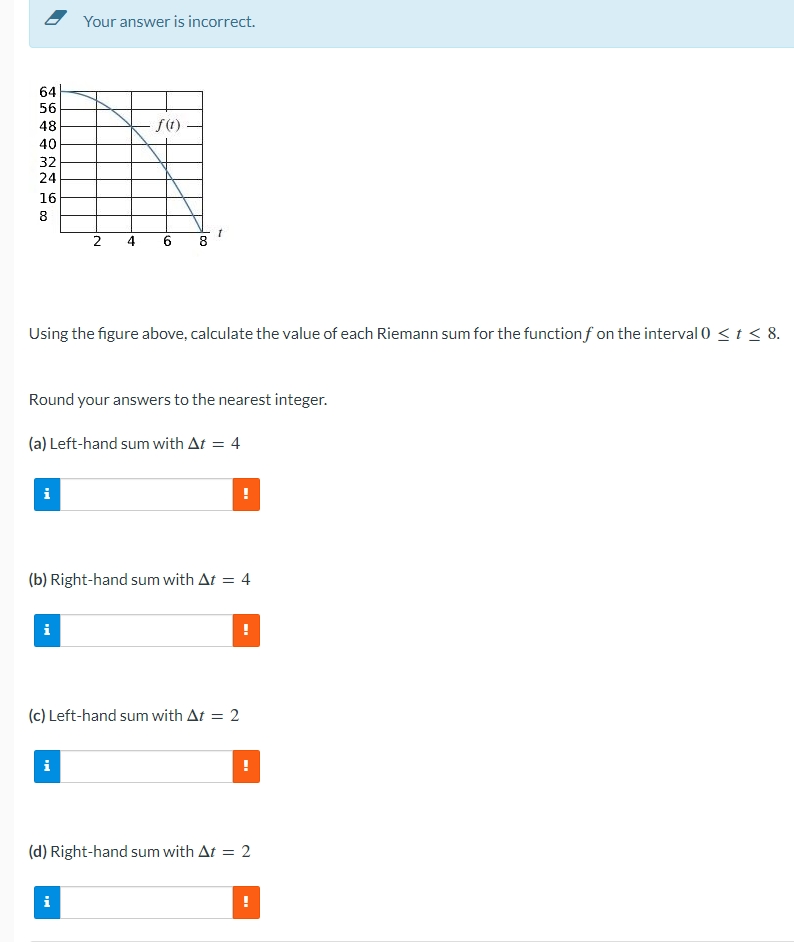
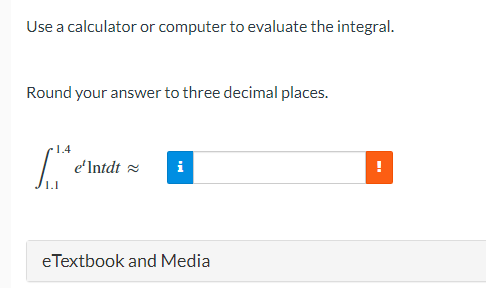
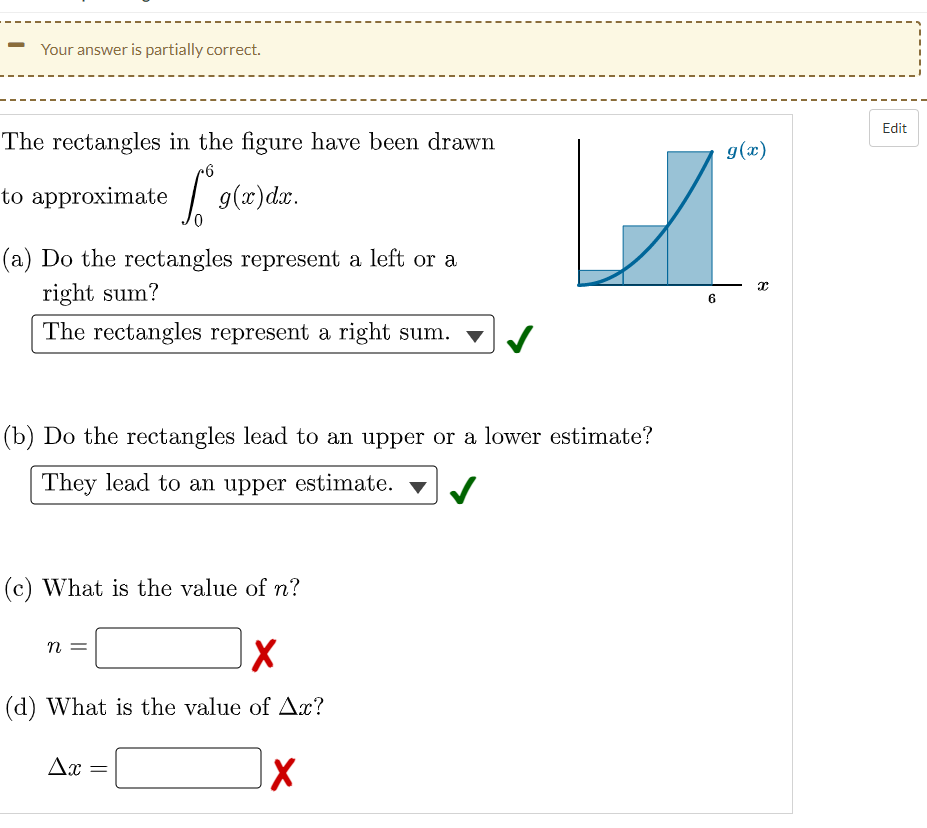
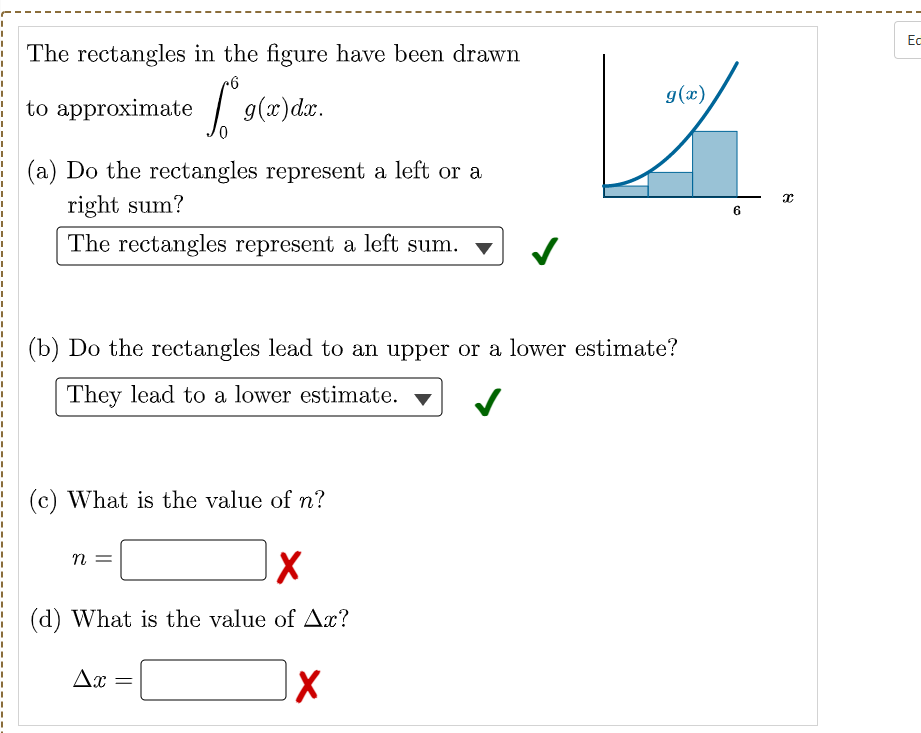
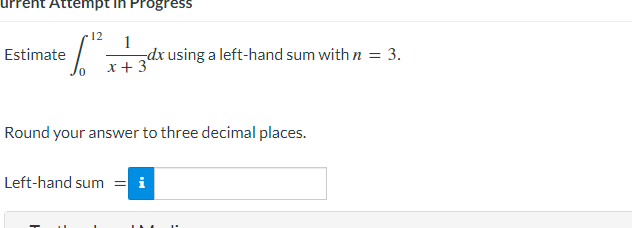


Your answer is partially correct. The rectangles in the figure have been drawn Edit to approximate (a) Do the rectangles represent a left or a right sum? 6 The rectangles represent a right sum. (b) Do the rectangles lead to an upper or a lower estimate? They lead to an upper estimate. (c) What is the value of n? n = X (d) What is the value of Ax? Ax = XThe rectangles in the figure have been drawn Ec g (a) to approximate (a) Do the rectangles represent a left or a right sum? T 6 The rectangles represent a left sum. (b) Do the rectangles lead to an upper or a lower estimate? They lead to a lower estimate. (c) What is the value of n? n = X (d) What is the value of Ax? Ax = Xurrent Attempt in Progress 12 Estimate dx using a left-hand sum with n = 3. x+3 Round your answer to three decimal places. Left-hand sum\f5 Your answer is incorrect Using the gure above,ca|culatethe 1value of each Riemann sumfor the functionfon the interval E t 5 8. Round 1your answers to the nearest integer. {a} Lefthand sum with or : 4 {h} Righthand sum with or = 4 {c} Lefthand sum with or = 2 {d} Righthand sum with 311' = 2 Use a calculator or computer to evaluate the integral. Round your answer to three decimal places. 1.4 e'Intdt ~ HI 1. I eTextbook and Media
Step by Step Solution
There are 3 Steps involved in it

Get step-by-step solutions from verified subject matter experts