

Question: Your CEO is curious about how data visualization works. The CEO has a file of customer loans and he wants to be able to visualize
Your CEO is curious about how data visualization works. The CEO has a file of customer loans and he wants to be able to visualize the information. It is your task to discover the best way to visualize the data you have been given. The following is the necessary information to complete this lab assignment.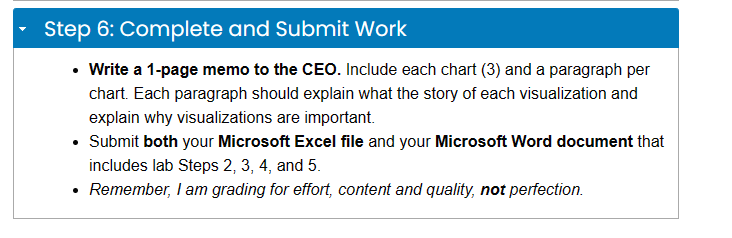

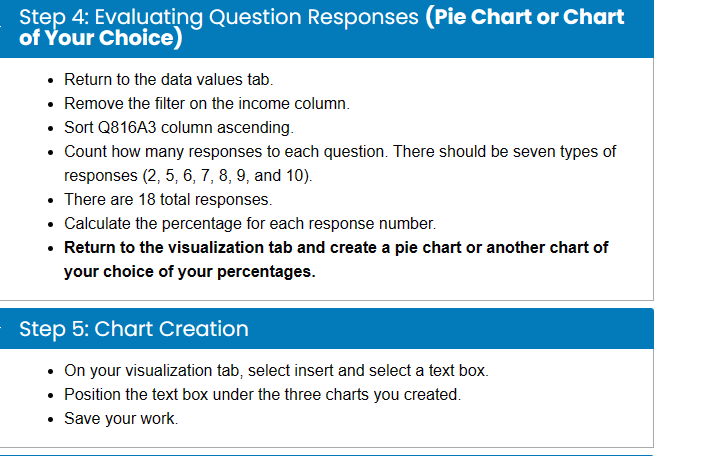
Step 6: Complete and Submit Work - Write a 1-page memo to the CEO. Include each chart (3) and a paragraph per chart. Each paragraph should explain what the story of each visualization and explain why visualizations are important. - Submit both your Microsoft Excel file and your Microsoft Word document that includes lab Steps 2, 3, 4, and 5. - Remember, I am grading for effort, content and quality, not perfection. Step 6: Complete and Submit Work - Write a 1-page memo to the CEO. Include each chart (3) and a paragraph per chart. Each paragraph should explain what the story of each visualization and explain why visualizations are important. - Submit both your Microsoft Excel file and your Microsoft Word document that includes lab Steps 2, 3, 4, and 5. - Remember, I am grading for effort, content and quality, not perfection. Step 4: Evaluating Question Responses (Pie Chart or Chart of Your Choice) - Return to the data values tab. - Remove the filter on the income column. - Sort Q816A3 column ascending. - Count how many responses to each question. There should be seven types of responses (2,5,6,7,8,9, and 10). - There are 18 total responses. - Calculate the percentage for each response number. - Return to the visualization tab and create a pie chart or another chart of your choice of your percentages
Step by Step Solution
There are 3 Steps involved in it

Get step-by-step solutions from verified subject matter experts