

Question: Your final comparison considers Morton's EBIT margin, which is calculated as EBIT divided by sales. Refer to the data provided, and the associated scatter chart
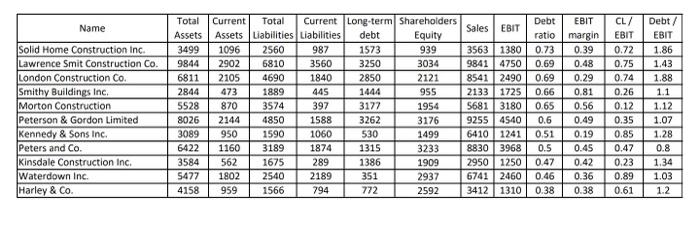
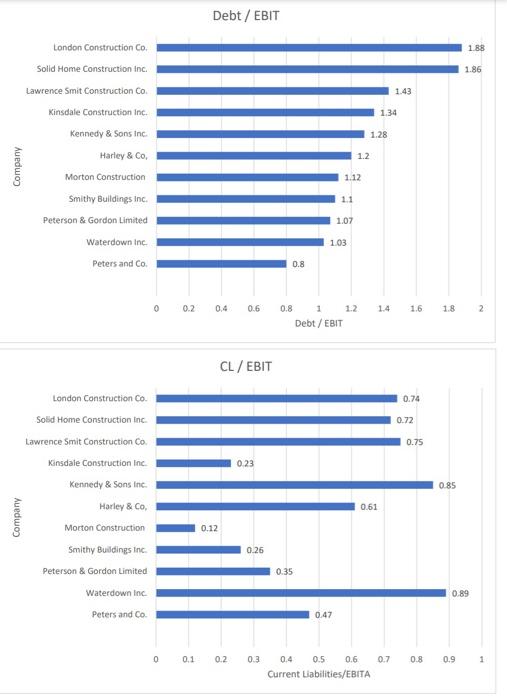
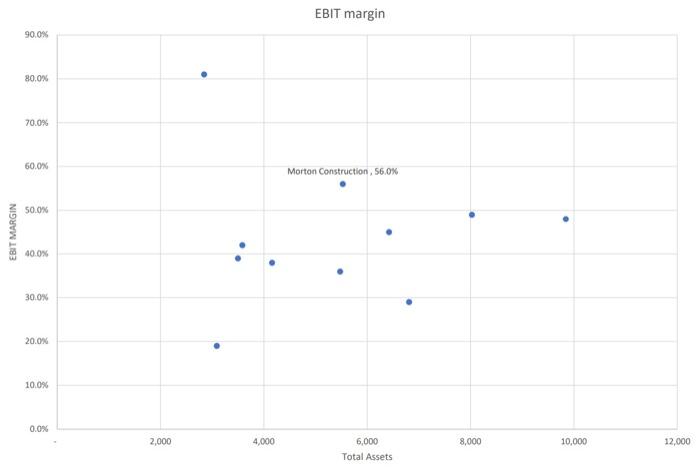
Your final comparison considers Morton's EBIT margin, which is calculated as EBIT divided by sales. Refer to the data provided, and the associated scatter chart which plots the EBIT margin against total assets for each company Based on the Morton's EBiT margin, relative to its peers, do you believe that the data supports an increase to Morton's credit limit? Please provide 1 or 2 sentences of rationale te justify your thoughts A Yes, based on Morton's EBIT margin relative to its peers. I would support an increase to Morton's creditimit 8. No, based on Morton's feit margin. retative to its peers, I would not support an increase to Morton's credit limit. Rationale Reset Select Name Sales | EBIT Solid Home Construction Inc. Lawrence Smit Construction Co. London Construction Co. Smithy Buildings Inc. Morton Construction Peterson & Gordon Limited Kennedy & Sons Inc. Peters and Co. Kinsdale Construction Inc. Waterdown Inc. Harley & Co. Total Current Total Current Long-term Shareholders Assets Assets Liabilities Liabilities debt Equity 3499 1096 2560 987 1573 939 9844 2902 6810 3560 3250 3034 6811 2105 4690 1840 2850 2121 2844 473 1889 445 1444 955 5528 870 3574 397 3177 1954 8026 2144 4850 1588 3262 3176 3089 950 1590 1060 530 1499 6422 1160 3189 1874 1315 3233 3584 562 1675 289 1386 1909 5477 1802 2540 2189 351 2937 4158 959 1566 794 772 2592 3563 1380 98414750 85412490 2133 | 1725 56813180 92554540 6410 1241 88303968 2950 1250 6741 2460 34121310 Debt ratio 0.73 0.69 0.69 0.66 0.65 0.6 0.51 0.5 0.47 0.46 0.38 EBIT margin 0.39 0.48 0.29 0.81 0.56 0.49 0.19 0.45 0.42 0.36 0.38 CL/ EBIT 0.72 0.75 0.74 0.26 0.12 0.35 0.85 0.47 0.23 0.89 0.61 Debt / EBIT 1.86 1.43 1.88 1.1 1.12 1.07 1.28 0.8 1.34 1.03 1.2 U Debt / EBIT 1.88 1.86 1.43 1.34 1.28 London Construction Co. Solid Home Construction Inc Lawrence Smit Construction Co Kinsdale Construction Inc. Kennedy & Sons Inc Harley & Co Morton Construction Smithy Buildings Inc. Peterson & Gordon Limited Waterdown Inc. Peters and Co 1.2 Company 11 1.07 103 0.8 0 0.2 0.4 0.6 1.8 2 0.8 1 1.2 1.4 1.6 Debt / EBIT CL / EBIT 0.74 London Construction Co. Solid Home Construction Inc. 0.72 Lawrence Smit Construction Co. 0.75 0.23 0.85 0.61 Kinsdale Construction Inc. Kennedy & Sons Inc Harley & Co. Morton Construction Smithy Buildings Inc Peterson & Gordon Limited Company 0.12 0.26 0.35 Waterdown Inc. 0.89 Peters and Co. 0.47 0 0.1 0.2 03 0.7 0.8 0.9 1 0.4 0.5 0.6 Current Liabilities/EBITA EBIT margin 90.0% 80.0% 70.0% 60.0% Morton Construction, 56.0% 50.0% EBIT MARGIN 40.0% 30.0% 20.0% 10.0% 0.0% 2,000 4,000 8,000 10,000 12,000 6,000 Total Assets Your final comparison considers Morton's EBIT margin, which is calculated as EBIT divided by sales. Refer to the data provided, and the associated scatter chart which plots the EBIT margin against total assets for each company Based on the Morton's EBiT margin, relative to its peers, do you believe that the data supports an increase to Morton's credit limit? Please provide 1 or 2 sentences of rationale te justify your thoughts A Yes, based on Morton's EBIT margin relative to its peers. I would support an increase to Morton's creditimit 8. No, based on Morton's feit margin. retative to its peers, I would not support an increase to Morton's credit limit. Rationale Reset Select Name Sales | EBIT Solid Home Construction Inc. Lawrence Smit Construction Co. London Construction Co. Smithy Buildings Inc. Morton Construction Peterson & Gordon Limited Kennedy & Sons Inc. Peters and Co. Kinsdale Construction Inc. Waterdown Inc. Harley & Co. Total Current Total Current Long-term Shareholders Assets Assets Liabilities Liabilities debt Equity 3499 1096 2560 987 1573 939 9844 2902 6810 3560 3250 3034 6811 2105 4690 1840 2850 2121 2844 473 1889 445 1444 955 5528 870 3574 397 3177 1954 8026 2144 4850 1588 3262 3176 3089 950 1590 1060 530 1499 6422 1160 3189 1874 1315 3233 3584 562 1675 289 1386 1909 5477 1802 2540 2189 351 2937 4158 959 1566 794 772 2592 3563 1380 98414750 85412490 2133 | 1725 56813180 92554540 6410 1241 88303968 2950 1250 6741 2460 34121310 Debt ratio 0.73 0.69 0.69 0.66 0.65 0.6 0.51 0.5 0.47 0.46 0.38 EBIT margin 0.39 0.48 0.29 0.81 0.56 0.49 0.19 0.45 0.42 0.36 0.38 CL/ EBIT 0.72 0.75 0.74 0.26 0.12 0.35 0.85 0.47 0.23 0.89 0.61 Debt / EBIT 1.86 1.43 1.88 1.1 1.12 1.07 1.28 0.8 1.34 1.03 1.2 U Debt / EBIT 1.88 1.86 1.43 1.34 1.28 London Construction Co. Solid Home Construction Inc Lawrence Smit Construction Co Kinsdale Construction Inc. Kennedy & Sons Inc Harley & Co Morton Construction Smithy Buildings Inc. Peterson & Gordon Limited Waterdown Inc. Peters and Co 1.2 Company 11 1.07 103 0.8 0 0.2 0.4 0.6 1.8 2 0.8 1 1.2 1.4 1.6 Debt / EBIT CL / EBIT 0.74 London Construction Co. Solid Home Construction Inc. 0.72 Lawrence Smit Construction Co. 0.75 0.23 0.85 0.61 Kinsdale Construction Inc. Kennedy & Sons Inc Harley & Co. Morton Construction Smithy Buildings Inc Peterson & Gordon Limited Company 0.12 0.26 0.35 Waterdown Inc. 0.89 Peters and Co. 0.47 0 0.1 0.2 03 0.7 0.8 0.9 1 0.4 0.5 0.6 Current Liabilities/EBITA EBIT margin 90.0% 80.0% 70.0% 60.0% Morton Construction, 56.0% 50.0% EBIT MARGIN 40.0% 30.0% 20.0% 10.0% 0.0% 2,000 4,000 8,000 10,000 12,000 6,000 Total Assets
Step by Step Solution
There are 3 Steps involved in it

Get step-by-step solutions from verified subject matter experts