

Question: Your goal for this lab is to create a scatter diagram of the data, then do a linear, exponential, and logarithmic regression. Provide the equations
Your goal for this lab is to create a scatter diagram of the data, then do a linear, exponential, and logarithmic regression. Provide the equations and the value of R^2 in your graphs. Do the regression on each book which you can see below. Then, predict the average stock price of APPLE INC. for the the year 2022. Of the three regressions that you did, which do you think will be the closest prediction for 2022?
PLEASE SHOW LINEAR, EXPONENTIAL AND LOGARITHMIC REGRESSION IN EXCEL. thank you :)
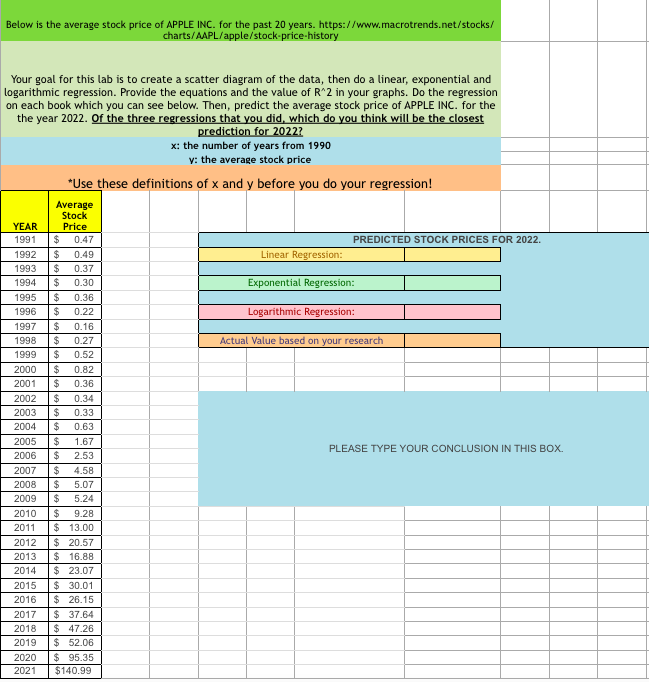
Below is the average stock price of APPLE INC. for the past 20 years. https://www.macrotrends.net/stocks/ charts/AAPL/apple/stock-price-history Your goal for this lab is to create a scatter diagram of the data, then do a linear, exponential and logarithmic regression. Provide the equations and the value of R^2 in your graphs. Do the regression on each book which you can see below. Then, predict the average stock price of APPLE INC. for the the year 2022. Of the three regressions that you did, which do you think will be the closest prediction for 2022? x: the number of years from 1990 y: the average stock price *Use these definitions of x and y before you do your regression! Average PREDICTED STOCK PRICES FOR 2022. Linear Regression: Exponential Regression: Logarithmic Regression: Actual Value based on your research YEAR 1991 1992 1993 1994 1995 1996 1997 1998 1999 2000 2001 2002 2003 2004 2005 2006 2007 2008 2009 2010 2011 2012 2013 2014 2015 2016 2017 2018 2019 2020 2021 Stock Price $ 0.47 0.49 $ 0.37 $ 0.30 $ 0.36 $ 0.22 $ 0.16 $ 0.27 $ 0.52 $ 0.82 $ 0.36 0.34 $ 0.33 $ 0.63 $ 1.67 $ 2.53 $ 4.58 $ 5.07 $ 5.24 $ 9.28 $ 13.00 $ 20.57 $ 16.88 $ 23.07 $ 30.01 $ 26.15 $ 37.64 $ 47.26 $ 52.06 $ 95.35 $140.99 PLEASE TYPE YOUR CONCLUSION IN THIS BOX. Below is the average stock price of APPLE INC. for the past 20 years. https://www.macrotrends.net/stocks/ charts/AAPL/apple/stock-price-history Your goal for this lab is to create a scatter diagram of the data, then do a linear, exponential and logarithmic regression. Provide the equations and the value of R^2 in your graphs. Do the regression on each book which you can see below. Then, predict the average stock price of APPLE INC. for the the year 2022. Of the three regressions that you did, which do you think will be the closest prediction for 2022? x: the number of years from 1990 y: the average stock price *Use these definitions of x and y before you do your regression! Average PREDICTED STOCK PRICES FOR 2022. Linear Regression: Exponential Regression: Logarithmic Regression: Actual Value based on your research YEAR 1991 1992 1993 1994 1995 1996 1997 1998 1999 2000 2001 2002 2003 2004 2005 2006 2007 2008 2009 2010 2011 2012 2013 2014 2015 2016 2017 2018 2019 2020 2021 Stock Price $ 0.47 0.49 $ 0.37 $ 0.30 $ 0.36 $ 0.22 $ 0.16 $ 0.27 $ 0.52 $ 0.82 $ 0.36 0.34 $ 0.33 $ 0.63 $ 1.67 $ 2.53 $ 4.58 $ 5.07 $ 5.24 $ 9.28 $ 13.00 $ 20.57 $ 16.88 $ 23.07 $ 30.01 $ 26.15 $ 37.64 $ 47.26 $ 52.06 $ 95.35 $140.99 PLEASE TYPE YOUR CONCLUSION IN THIS BOX
Step by Step Solution
There are 3 Steps involved in it

Get step-by-step solutions from verified subject matter experts