

Question: Your goal is to build a simple spreadsheet model to estimate C O 2 emissions ( tons ) in a given year from the North
Your goal is to build a simple spreadsheet model to estimate
emissions tons in a given year from the North
Carolina's light duty vehicle sector. Light duty vehicles include
passenger cars and light trucks. Please apply the techniques for
mastering complexity that were described in Module Once
developed, you will use your model to estimate current and future
emissions under different scenarios. For the problem above,
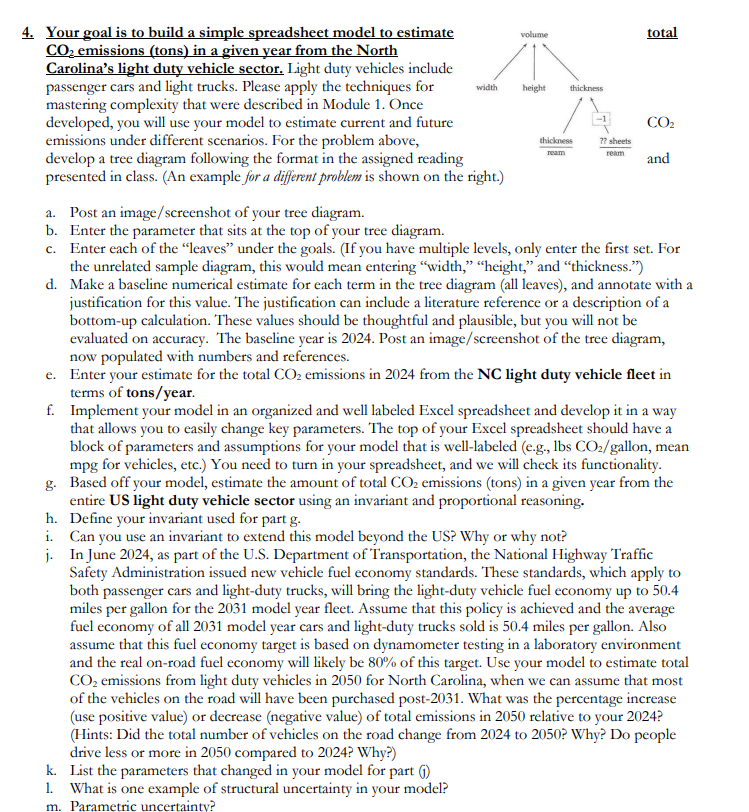
develop a tree diagram following the format in the assigned reading
presented in class. An example for a different problem is shown on the
a Post an imagescreenshot of your tree diagram.
b Enter the parameter that sits at the top of your tree diagram.
c Enter each of the "leaves" under the goals. If you have multiple levels, only enter the first set. For
the unrelated sample diagram, this would mean entering "width," "height," and "thickness."
d Make a baseline numerical estimate for each term in the tree diagram all leaves and annotate with a
justification for this value. The justification can include a literature reference or a description of a
bottomup calculation. These values should be thoughtful and plausible, but you will not be
evaluated on accuracy. The baseline year is Post an imagescreenshot of the tree diagram,
now populated with numbers and references.
e Enter your estimate for the total emissions in from the NC light duty vehicle fleet in
terms of tonsyear
f Implement your model in an organized and well labeled Excel spreadsheet and develop it in a way
that allows you to easily change key parameters. The top of your Excel spreadsheet should have a
block of parameters and assumptions for your model that is welllabeled eg lbs allon, mean
mpg for vehicles, etc. You need to turn in your spreadsheet, and we will check its functionality.
g Based off your model, estimate the amount of total emissions tons in a given year from the
entire US light duty vehicle sector using an invariant and proportional reasoning.
h Define your invariant used for part g
i Can you use an invariant to extend this model beyond the US Why or why not?
j In June as part of the US Department of Transportation, the National Highway Traffic
Safety Administration issued new vehicle fuel economy standards. These standards, which apply to
both passenger cars and lightduty trucks, will bring the lightduty vehicle fuel economy up to
miles per gallon for the model year fleet. Assume that this policy is achieved and the average
fuel economy of all model year cars and lightduty trucks sold is miles per gallon. Also
assume that this fuel economy target is based on dynamometer testing in a laboratory environment
and the real onroad fuel economy will likely be of this target. Use your model to estimate total
emissions from light duty vehicles in for North Carolina, when we can assume that most
of the vehicles on the road will have been purchased post What was the percentage increase
use positive value or decrease negative value of total emissions in relative to your
Hints: Did the total number of vehicles on the road change from to Why? Do people
drive less or more in compared to Why?
k List the parameters that changed in your model for part j
What is one example of structural uncertainty in your model?
m Parametric uncertainty?
Id really love help figuring out how to get this set up in excell. The tree diagram the questions mentioned at the top. is just side ways version of the one shown.
Here is a picture of the kind of tree diamgram he wants
Step by Step Solution
There are 3 Steps involved in it
1 Expert Approved Answer
Step: 1 Unlock

Question Has Been Solved by an Expert!
Get step-by-step solutions from verified subject matter experts
Step: 2 Unlock
Step: 3 Unlock