

Question: Your lab group will need to collect data from 10-20 people. You will then make a scatterplot and look for correlations. 1. Choose a
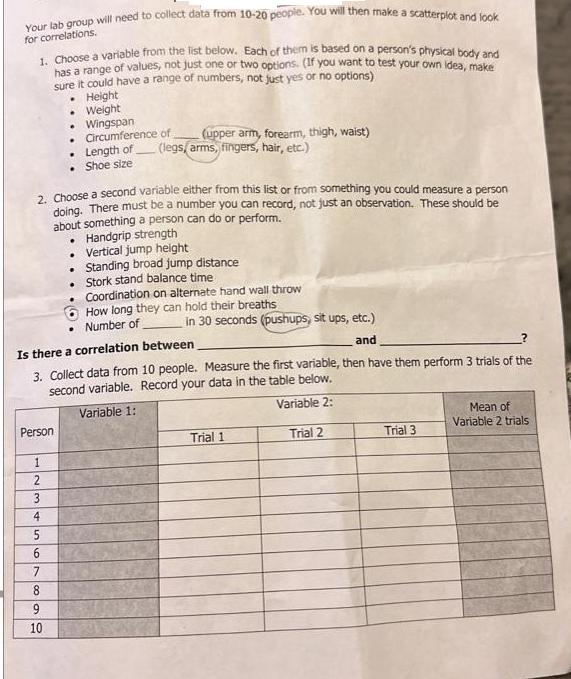
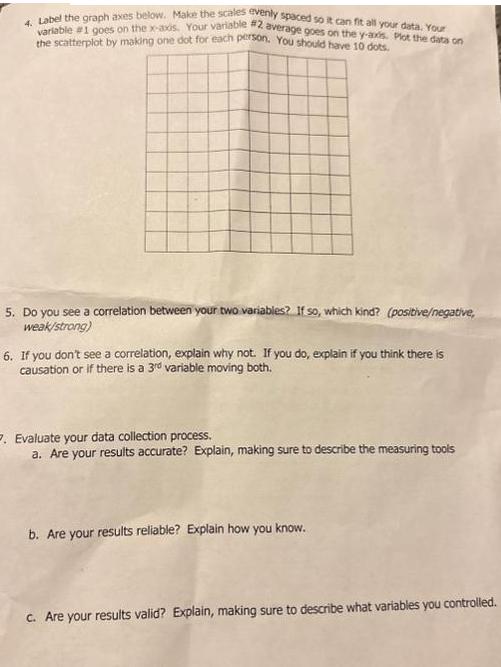
Your lab group will need to collect data from 10-20 people. You will then make a scatterplot and look for correlations. 1. Choose a variable from the list below. Each of them is based on a person's physical body and has a range of values, not just one or two options. (If you want to test your own idea, make sure it could have a range of numbers, not just yes or no options) Height . Weight Wingspan 2. Choose a second variable either from this list or from something you could measure a person doing. There must be a number you can record, not just an observation. These should be about something a person can do or perform. Handgrip strength Vertical jump height Person 1 2 3 Is there a correlation between 3. Collect data from 10 people. Measure the first variable, then have them perform 3 trials of the second variable. Record your data in the table below. Variable 1: Variable 2: 4 5 6 7 8 9 Circumference of (upper arm, forearm, thigh, waist) Length of (legs, arms, fingers, hair, etc.) Shoe size 10 S Standing broad jump distance Stork stand balance time Coordination on alternate hand wall throw How long they can hold their breaths Number of in 30 seconds (pushups, sit ups, etc.) and Trial 1 Trial 2 Trial 3 Mean of Variable 2 trials 4. Label the graph axes below. Make the scales evenly spaced so it can fit all your data. Your variable #1 goes on the x-axis. Your variable #2 average goes on the y-axis. Plot the data on the scatterplot by making one dot for each person. You should have 10 dots. 5. Do you see a correlation between your two variables? If so, which kind? (positive/negative, weak/strong) 6. If you don't see a correlation, explain why not. If you do, explain if you think there is causation or if there is a 3rd variable moving both. 2. Evaluate your data collection process. a. Are your results accurate? Explain, making sure to describe the measuring tools b. Are your results reliable? Explain how you know. c. Are your results valid? Explain, making sure to describe what variables you controlled.
Step by Step Solution
3.30 Rating (159 Votes )
There are 3 Steps involved in it
Variable 1 Height Variable 2 Handgrip strength Here is a table to record t... View full answer

Get step-by-step solutions from verified subject matter experts