

Question: Your next task for the Policy Brief is to compute the numerical value of the fiscal multiplier in current economic conditions. To calculate the value
- Your next task for the Policy Brief is to compute the numerical value of the fiscal multiplier in current economic conditions.
To calculate the value of the multiplier, you have information showing that Australians pay an average rate of 24% in income tax, and that Australians spend about one-sixth (16%) of their income on imports.
To figure out the other information that you will need to calculate the value of the multiplier, you should use the ABS data from the previous question (part (b)) on the household saving ratio for June 2020.
When you undertake your calculation, your manager has asked you to provide the formula for the fiscal multiplier and provide the full steps of your working, to show how you arrived at your answer. Round off your final answer to 2 decimal points.
When you present your answer, write a clear sentence explaining how to interpret this final number.
- Now that you have computed the value of the multiplier, calculate your forecast of the overall impact of the governments $257 billion stimulus package once the full effects are circulated throughout the economy.
You can use the value of multiplier rounded off to 2 decimal places, and present your final answer also rounded off to 2 decimal places.
Again, be sure to show all your working because this will be needed in the Policy Brief.
info from part b:
When you present your answer, write a clear sentence explaining how to interpret this final number.
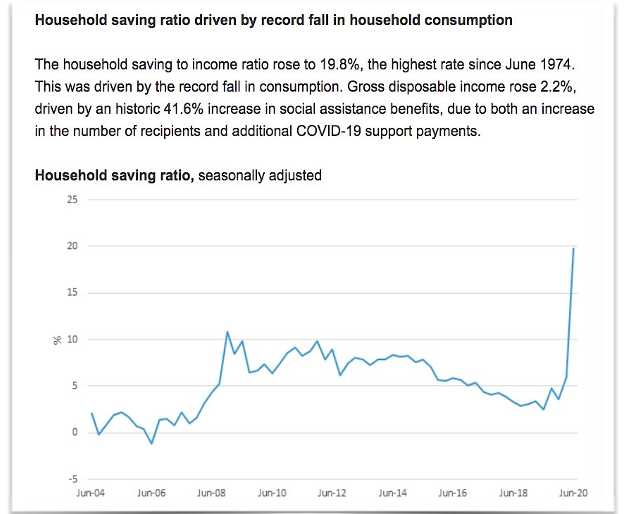
Household saving ratio driven by record fall in household consumption The household saving to income ratio rose to 19.8%, the highest rate since June 1974. This was driven by the record fall in consumption. Gross disposable income rose 2.2%, driven by an historic 41.6% increase in social assistance benefits, due to both an increase in the number of recipients and additional COVID-19 support payments. Household saving ratio, seasonally adjusted 25 20 15 * 10 5 0 -5 Jun-04 Jun-06 Jun-08 Jun-10 Jun-12 Jun-14 Jun-16 Jun-18 Jun-20 Household saving ratio driven by record fall in household consumption The household saving to income ratio rose to 19.8%, the highest rate since June 1974. This was driven by the record fall in consumption. Gross disposable income rose 2.2%, driven by an historic 41.6% increase in social assistance benefits, due to both an increase in the number of recipients and additional COVID-19 support payments. Household saving ratio, seasonally adjusted 25 20 15 * 10 5 0 -5 Jun-04 Jun-06 Jun-08 Jun-10 Jun-12 Jun-14 Jun-16 Jun-18 Jun-20
Step by Step Solution
There are 3 Steps involved in it

Get step-by-step solutions from verified subject matter experts