

Question: Your supervisor needs some help performing financial analysis concerning two companies-Ford (F) and Microsoft (MSFT). She asked you to: 1. Download each company's annual
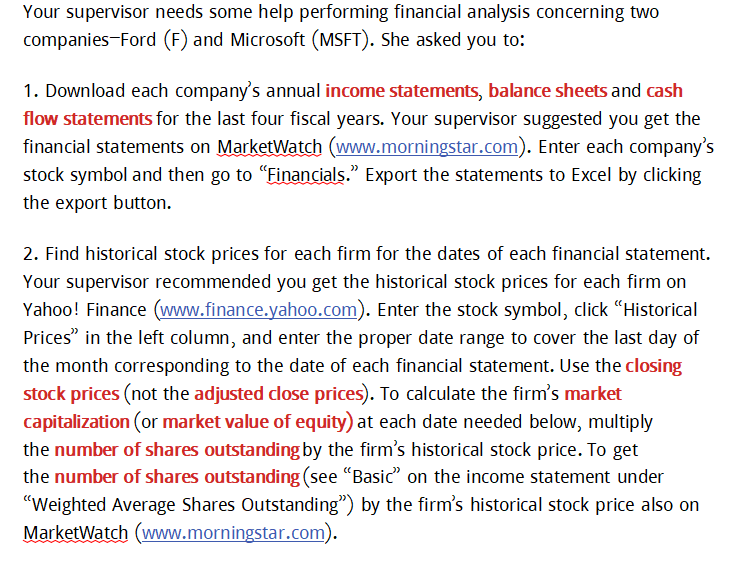
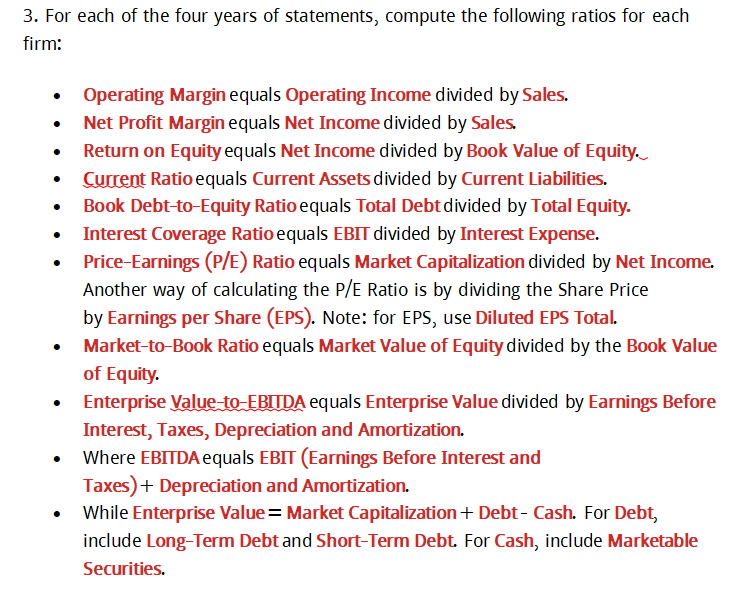
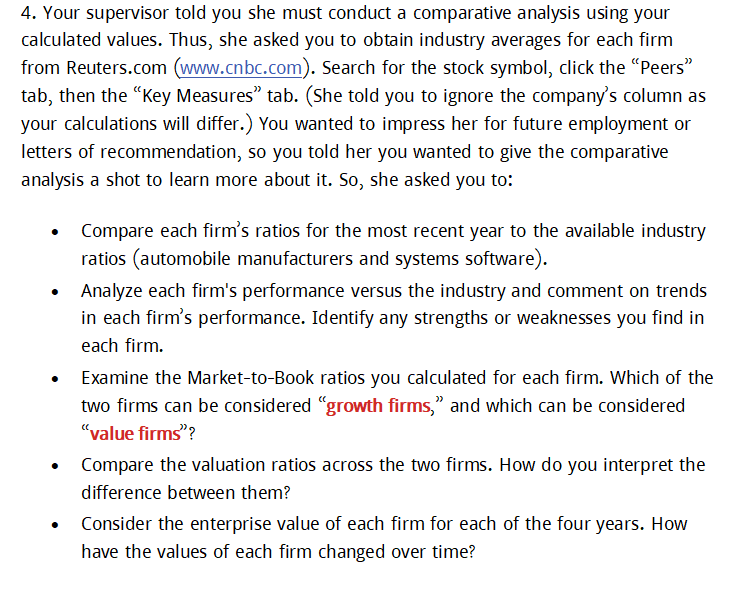
Your supervisor needs some help performing financial analysis concerning two companies-Ford (F) and Microsoft (MSFT). She asked you to: 1. Download each company's annual income statements, balance sheets and cash flow statements for the last four fiscal years. Your supervisor suggested you get the financial statements on MarketWatch (www.morningstar.com). Enter each company's stock symbol and then go to Financials. Export the statements to Excel by clicking the export button. 2. Find historical stock prices for each firm for the dates of each financial statement. Your supervisor recommended you get the historical stock prices for each firm on Yahoo! Finance (www.finance.yahoo.com). Enter the stock symbol, click "Historical Prices" in the left column, and enter the proper date range to cover the last day of the month corresponding to the date of each financial statement. Use the closing stock prices (not the adjusted close prices). To calculate the firm's market capitalization (or market value of equity) at each date needed below, multiply the number of shares outstanding by the firm's historical stock price. To get the number of shares outstanding (see "Basic" on the income statement under "Weighted Average Shares Outstanding") by the firm's historical stock price also on MarketWatch (www.morningstar.com). 3. For each of the four years of statements, compute the following ratios for each firm: Operating Margin equals Operating Income divided by Sales. Net Profit Margin equals Net Income divided by Sales. Return on Equity equals Net Income divided by Book Value of Equity. Current Ratio equals Current Assets divided by Current Liabilities. Book Debt-to-Equity Ratio equals Total Debt divided by Total Equity. Interest Coverage Ratio equals EBIT divided by Interest Expense. Price-Earnings (P/E) Ratio equals Market Capitalization divided by Net Income. Another way of calculating the P/E Ratio is by dividing the Share Price by Earnings per share (EPS). Note: for EPS, use Diluted EPS Total. Market-to-Book Ratio equals Market Value of Equity divided by the Book Value of Equity. Enterprise Value to EBITDA equals Enterprise Value divided by Earnings Before Interest, Taxes, Depreciation and Amortization. Where EBITDA equals EBIT (Earnings Before Interest and Taxes)+ Depreciation and Amortization. While Enterprise Value = Market Capitalization + Debt-Cash. For Debt, include Long-Term Debt and Short-Term Debt. For Cash, include Marketable Securities. 4. Your supervisor told you she must conduct a comparative analysis using your calculated values. Thus, she asked you to obtain industry averages for each firm from Reuters.com (www.cnbc.com). Search for the stock symbol, click the "Peers" tab, then the "Key Measures" tab. (She told you to ignore the company's column as your calculations will differ.) You wanted to impress her for future employment or letters of recommendation, so you told her you wanted to give the comparative analysis a shot to learn more about it. So, she asked you to: Compare each firm's ratios for the most recent year to the available industry ratios (automobile manufacturers and systems software). Analyze each firm's performance versus the industry and comment on trends in each firm's performance. Identify any strengths or weaknesses you find in each firm. Examine the Market-to-Book ratios you calculated for each firm. Which of the two firms can be considered "growth firms," and which can be considered "value firms"? Compare the valuation ratios across the two firms. How do you interpret the difference between them? Consider the enterprise value of each firm for each of the four years. How have the values of each firm changed over time?
Step by Step Solution
There are 3 Steps involved in it

Get step-by-step solutions from verified subject matter experts