

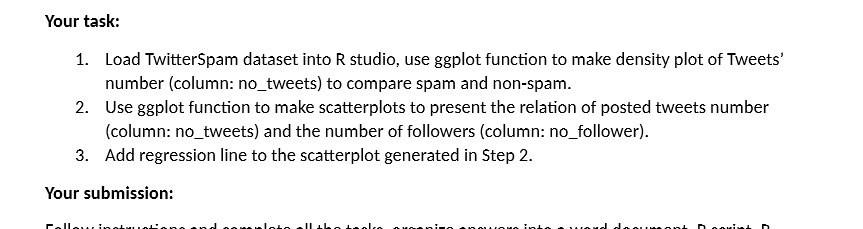
Question: Your task: 1. Load TwitterSpam dataset into R studio, use ggplot function to make density plot of Tweets' number (column: no_tweets) to compare spam and
Step by Step Solution
There are 3 Steps involved in it
1 Expert Approved Answer
Step: 1 Unlock

Question Has Been Solved by an Expert!
Get step-by-step solutions from verified subject matter experts
Step: 2 Unlock
Step: 3 Unlock