

Question: Your task in this exercise is to design a flow chart for a program that shows the odd numbers between 0 and n (i.e. user
Your task in this exercise is to design a flow chart for a program that shows the odd numbers between 0 and n (i.e. user input), and displays their sum and their average. For example, if user enters 20, the program output is expected to be:
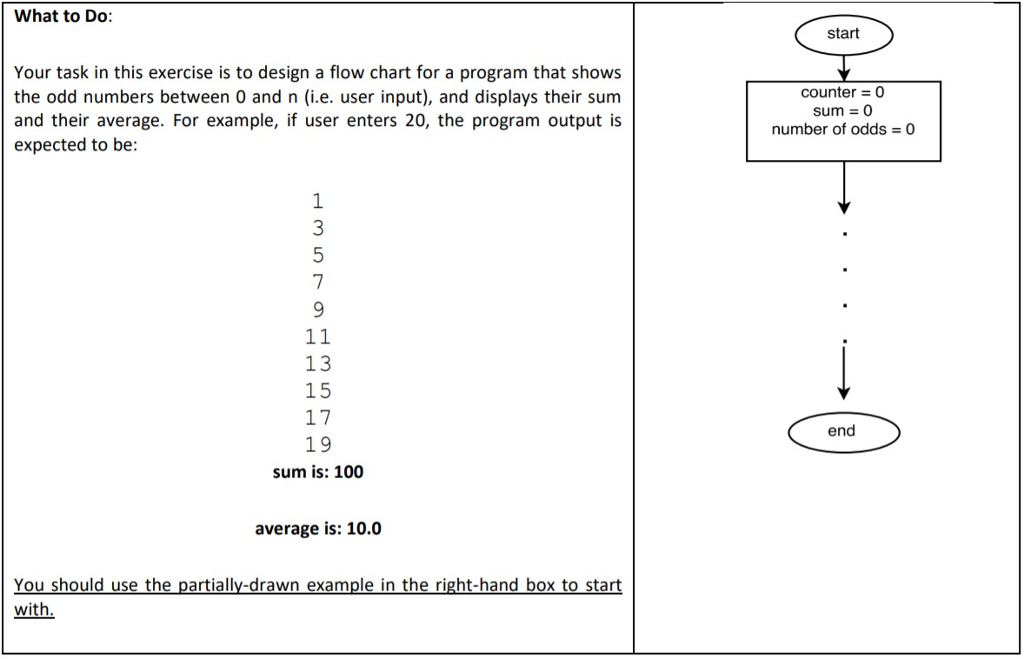
What to Do: start Your task in this exercise is to design a flow chart for a program that shows the odd numbers between 0 and n (i.e. user input), and displays their sum and their average. For example, if user enters 20, the program output is expected to be counter 0 sum = 0 number of odds 0 13 15 17 19 sum is: 100 end average is: 10.0 You should use the partially-drawn example in the right-hand box to start with
Step by Step Solution
There are 3 Steps involved in it

Get step-by-step solutions from verified subject matter experts