

Question: Your task will be to analyse the data in a three - step pipeline and then focus on the interpretation of results in step 4
Your task will be to analyse the data in a threestep pipeline and then focus on the interpretation
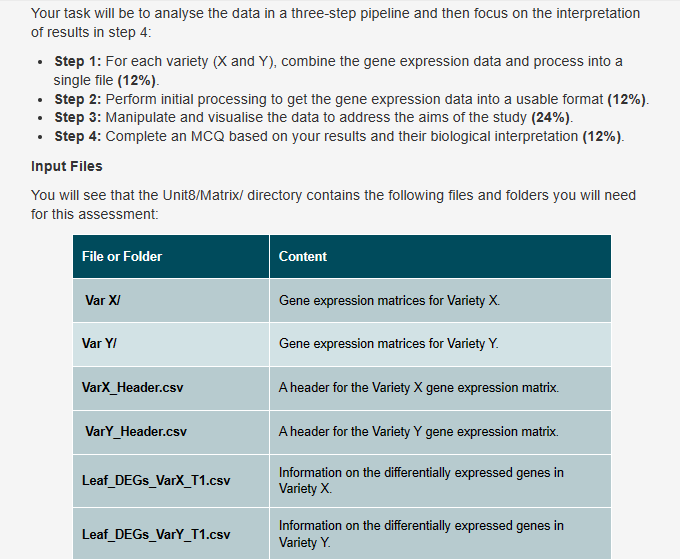
of results in step :
Step : For each variety and combine the gene expression data and process into a
single file
Step : Perform initial processing to get the gene expression data into a usable format
Step : Manipulate and visualise the data to address the aims of the study
Step : Complete an MCQ based on your results and their biological interpretation
Input Files
You will see that the UnitMatrix directory contains the following files and folders you will need
for this assessment: The gene expression data is currently split up into several files within various subdirectories of the rdshomesuusernamemoduleintrotobiologyandprogrammingUnitMatrix directory. Your task will be to analyse the data in a threestep pipeline and then focus on the interpretation
of results in step :
Step : For each variety and combine the gene expression data and process into a
single file
Step : Perform initial processing to get the gene expression data into a usable format
Step : Manipulate and visualise the data to address the aims of the study
Step : Complete an MCQ based on your results and their biological interpretation
Write a Bash script that can be run within the Matrixdirectory to process the gene expression matrices to produce the following two output files:
A single csv file containing the gene expression matrix for variety X including the header line. You should name this file GEMXcsv GEM stands for Gene Expression Matrix
A single csv file containing the gene expression matrix for variety Y including the header line. You should name this file GEMYcsv
In the file headers, each sample name for the columns of the matrix currently has the following format:
Variety, followed by condition code C or and biological replicate ab or c C is the control, and are the stress conditions. For example,
denotes Variety X Treatment C and replicate a
Your gene expression matrix files should:
Contain only unique genes located on the chromosomes, with genes sorted by chromosome.
Change the column labels in the header to a more convenient format, replacing a with Repb with Rep and c with Rep In the above example,
becomes
Your submitted Linux script should be called Linuxyour initials.sh eg LinuxLCsh
Now you have collected all the data into a single gene expression matrix for each Variety, you should use Python to select the gene expression data from two conditions only and change the format into something that will be easier to analyse in R
Create a Jupyter Notebook or a plain Python script which takes the following inputs:
The two gene expression matrices you created in Step for varieties X and Y
The two files containing information on the differentially expressed genes.
And gives the following outputs:
Two gene expression matrices one for each Variety each with a header, and containing gene expression from two conditions only: the control condition in columns ; replicates and stress treatment condition columns ; replicates You should name your files allVarXTwoTimePoints.csv and allVarYTwoTimePoints.csv
Two files, each with a header, containing information on the differentially expressed genes for each variety, and containing a subset of columns in this order: genename, logFoldChange, padj, AthalianageneID and GeneFunction, followed by an additional six columns for the expression of the three replicates in each of the two conditions in the order given above. You should name your files LeafDEGsVarX.csv and LeafDEGsVarY.csv
The meaning of the selected columns relating to differential gene expression are given below:
logFoldChange: The logarithm to the base of the expression ratio between the treatment condition and the control condition. This is a convenient way to quantify the change in expression between two conditions because a logFC means the expression has doubled in the treatment condition whereas logFC would mean the expression has halved.
padj: An adjusted pvalue. You will learn more about the pvalue in a future module. For now, this probability value gives a measure of how likely it is that the gene expression change is "real" instead of being seen by chance. The lower the pvalue, the more "significant" we deem the change in expression to be
AthalianageneID: The corresponding gene in the model plant Arabidopsis thaliana. This can be very useful information for downstream functional analysis of genes when working with crops like potatoes.
GeneFunction: Functional information available for the gene what does it do
Step by Step Solution
There are 3 Steps involved in it
1 Expert Approved Answer
Step: 1 Unlock

Question Has Been Solved by an Expert!
Get step-by-step solutions from verified subject matter experts
Step: 2 Unlock
Step: 3 Unlock