

Question: YouTube Maps m Test #1 Fall2020 A Saved Consider the following data for Magnimus Corporation. July 4,300 $430,000 78,260 95,460 61,230 34,400 39,970 32,300 Sales
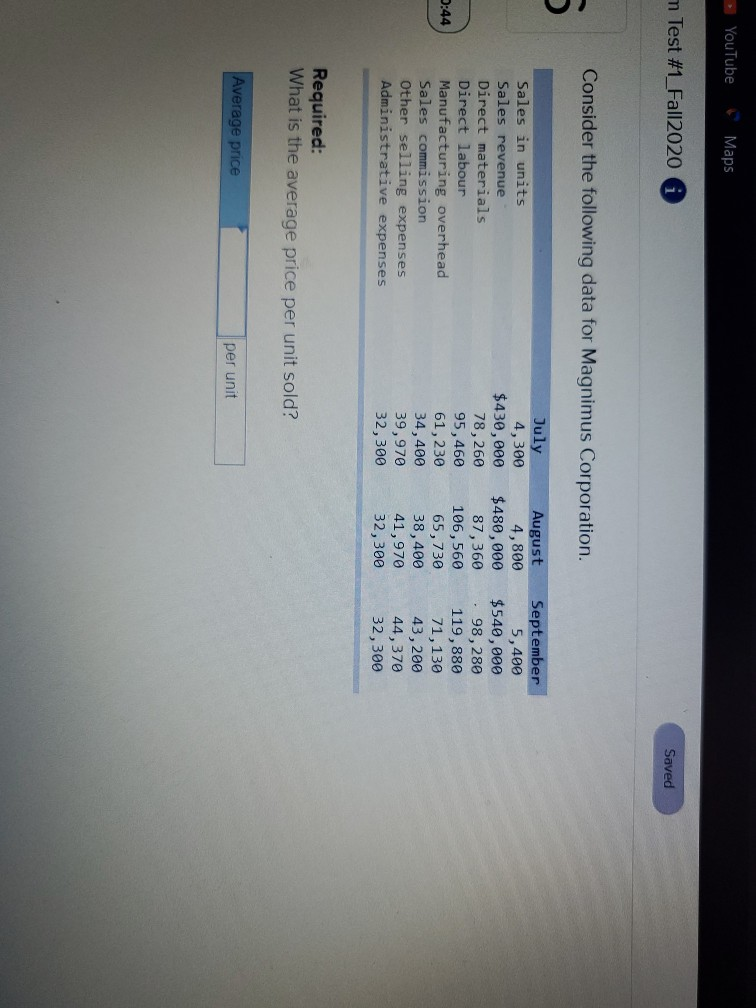
YouTube Maps m Test #1 Fall2020 A Saved Consider the following data for Magnimus Corporation. July 4,300 $430,000 78,260 95,460 61,230 34,400 39,970 32,300 Sales in units Sales revenue Direct materials Direct labour Manufacturing overhead Sales commission Other selling expenses Administrative expenses August 4,800 $480,000 87,360 106,560 65,730 38,400 41,970 32,300 September 5,400 $540,000 98,280 119,880 71,130 43,200 44,370 32,300 5:44 Required: What is the average price per unit sold? Average price per unit
Step by Step Solution
There are 3 Steps involved in it
1 Expert Approved Answer
Step: 1 Unlock

Question Has Been Solved by an Expert!
Get step-by-step solutions from verified subject matter experts
Step: 2 Unlock
Step: 3 Unlock