

Question: You've been assigned as a PM for a website development project. Their goals are to complete the project in 12 months for a budge of
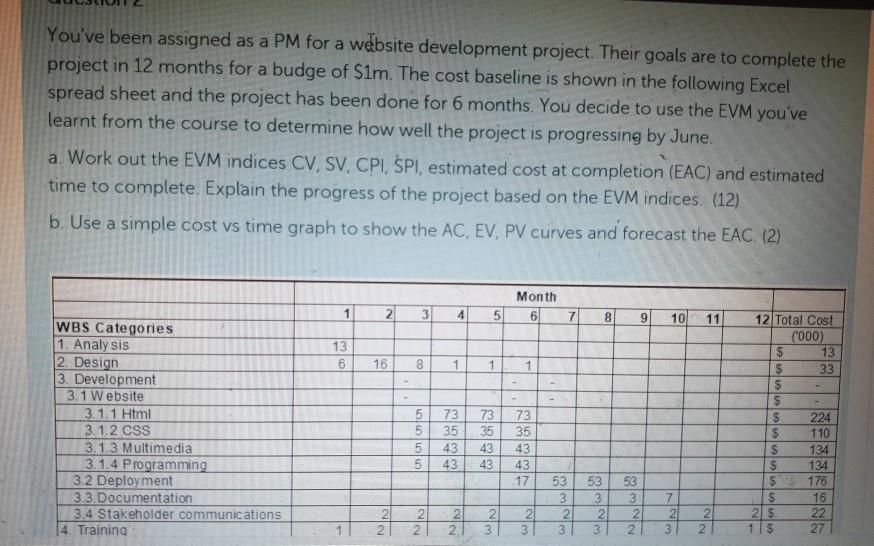
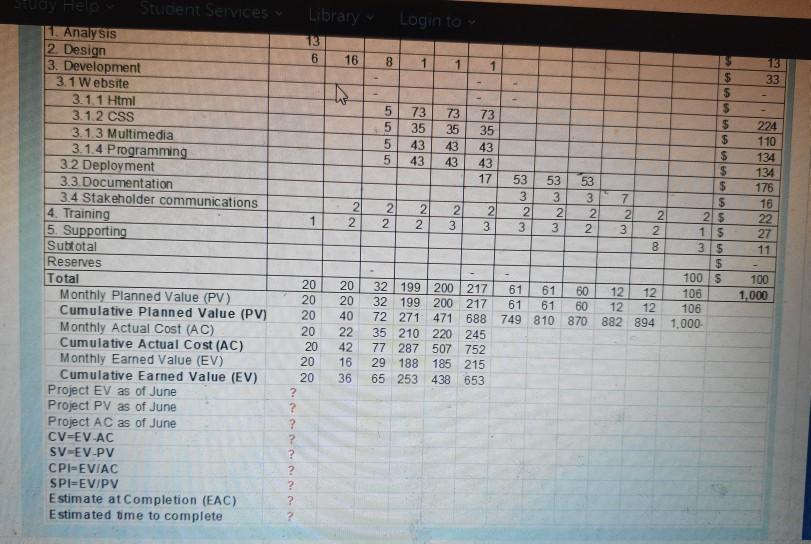
You've been assigned as a PM for a website development project. Their goals are to complete the project in 12 months for a budge of Sim. The cost baseline is shown in the following Excel spread sheet and the project has been done for 6 months. You decide to use the EVM you've learnt from the course to determine how well the project is progressing by June a. Work out the EVM indices CV, SV, CPI, PI, estimated cost at completion (EAC) and estimated time to complete. Explain the progress of the project based on the EVM indices. (12) b. Use a simple cost vs time graph to show the AC, EV, PV curves and forecast the EAC (2) 2 Month 6 4 5 7 8 9 10 11 13 6 16 8 1 1 WBS Categories 1. Analysis 2. Design 3. Development 3.1 Website 3.1.1 Html 3.1.2 CSS 3.1.3 Multimedia 3.1.4 Programming 3.2 Deployment 3.3.Documentation 3.4 Stakeholder communications 14. Training on ononton 73 73 35 35 43 43 43 43 73 35 43 43 17 12 Total Cost ('000) $ 13 $ 33 $ $ $ 224 $ 110 $ 134 $ 134 $ 176 $ 16 25 22 115 27 18/ 53 3 2 3 53 3 2 2 21 2 2 21 2 3 2 3 NN 2 3 2 3 7 2 3 Library 13 Login to 6 16 co 1 1 1 13 33 $ als 5 224 110 134 134 176 16 22 27 11 NN W. NN 1 Student Services 1. Analysis 2. Design 3. Development 3.1 Website 3.11 Html 3.1.2 CSS 3.1.3 Multimedia 3.1.4 Programming 3.2 Deployment 3.3. Documentation 3.4 Stakeholder communications 4. Training 5. Supporting Subtotal Reserves Total Monthly Planned Value (PV) Cumulative Planned Value (PV) Monthly Actual Cost (AC) Cumulative Actual Cost (AC) Monthly Earned Value (EV) Cumulative Earned Value (EV) Project EV as of June Project PV as of June Project AC as of June CV-EV-AC SV-EV-PV CPI-EVIAC SPIEV/PV Estimate at Completion (EAC) Estimated time to complete 5 $ 73 73 73 5 35 $ 35 35 $ 5 43 43 43 5 $ 43 43 43 $ 17 53 53 53 $ 3 3 3 7 5 2 2 2 21 2 2 2 2 2 2 $ 2 2 3 3 3 2 3 2 15 8 35 $ 1005 32199 200 217 61 61 60 12 12 106 32 199 200 217 61 61 60 12 12 106 72 271 471 688 749 810 870 882 894 1.000- 35 210 220 245 77 287 507 752 29 188 185 215 65 253 438 653 1 100 1,000 20 20 40 22 42 16 36 20 20 20 20 20 20 20 ? ? ? ? ? 2 ? ? ? You've been assigned as a PM for a website development project. Their goals are to complete the project in 12 months for a budge of Sim. The cost baseline is shown in the following Excel spread sheet and the project has been done for 6 months. You decide to use the EVM you've learnt from the course to determine how well the project is progressing by June a. Work out the EVM indices CV, SV, CPI, PI, estimated cost at completion (EAC) and estimated time to complete. Explain the progress of the project based on the EVM indices. (12) b. Use a simple cost vs time graph to show the AC, EV, PV curves and forecast the EAC (2) 2 Month 6 4 5 7 8 9 10 11 13 6 16 8 1 1 WBS Categories 1. Analysis 2. Design 3. Development 3.1 Website 3.1.1 Html 3.1.2 CSS 3.1.3 Multimedia 3.1.4 Programming 3.2 Deployment 3.3.Documentation 3.4 Stakeholder communications 14. Training on ononton 73 73 35 35 43 43 43 43 73 35 43 43 17 12 Total Cost ('000) $ 13 $ 33 $ $ $ 224 $ 110 $ 134 $ 134 $ 176 $ 16 25 22 115 27 18/ 53 3 2 3 53 3 2 2 21 2 2 21 2 3 2 3 NN 2 3 2 3 7 2 3 Library 13 Login to 6 16 co 1 1 1 13 33 $ als 5 224 110 134 134 176 16 22 27 11 NN W. NN 1 Student Services 1. Analysis 2. Design 3. Development 3.1 Website 3.11 Html 3.1.2 CSS 3.1.3 Multimedia 3.1.4 Programming 3.2 Deployment 3.3. Documentation 3.4 Stakeholder communications 4. Training 5. Supporting Subtotal Reserves Total Monthly Planned Value (PV) Cumulative Planned Value (PV) Monthly Actual Cost (AC) Cumulative Actual Cost (AC) Monthly Earned Value (EV) Cumulative Earned Value (EV) Project EV as of June Project PV as of June Project AC as of June CV-EV-AC SV-EV-PV CPI-EVIAC SPIEV/PV Estimate at Completion (EAC) Estimated time to complete 5 $ 73 73 73 5 35 $ 35 35 $ 5 43 43 43 5 $ 43 43 43 $ 17 53 53 53 $ 3 3 3 7 5 2 2 2 21 2 2 2 2 2 2 $ 2 2 3 3 3 2 3 2 15 8 35 $ 1005 32199 200 217 61 61 60 12 12 106 32 199 200 217 61 61 60 12 12 106 72 271 471 688 749 810 870 882 894 1.000- 35 210 220 245 77 287 507 752 29 188 185 215 65 253 438 653 1 100 1,000 20 20 40 22 42 16 36 20 20 20 20 20 20 20 ? ? ? ? ? 2
Step by Step Solution
There are 3 Steps involved in it

Get step-by-step solutions from verified subject matter experts