

Question: [You've been hired by Microsoft Monarchs to write a Java console application that analyzes their stock data over the past eleven years. Use text le
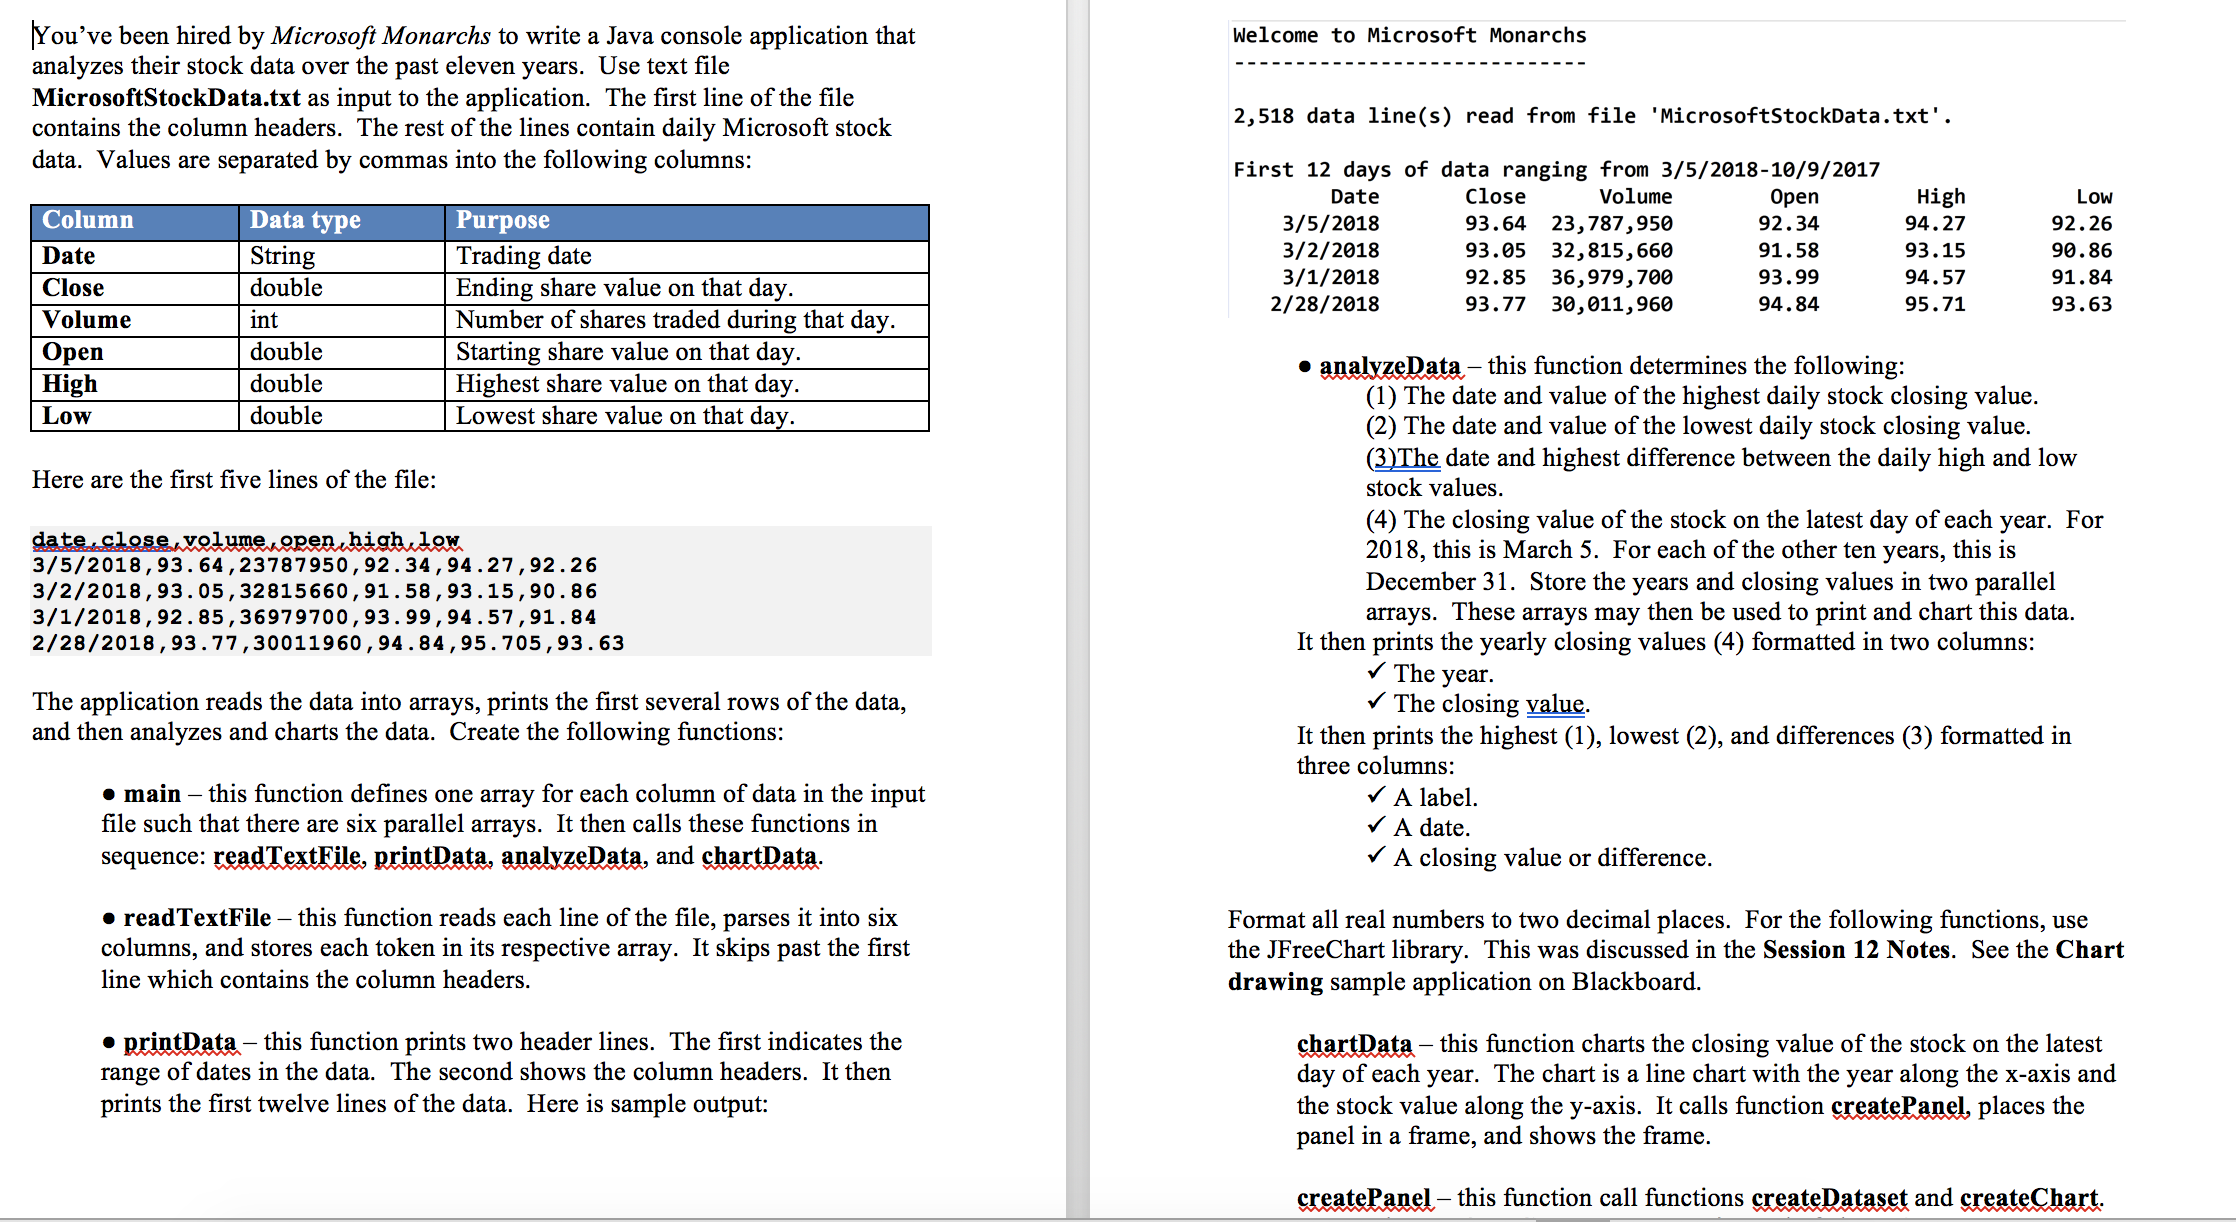
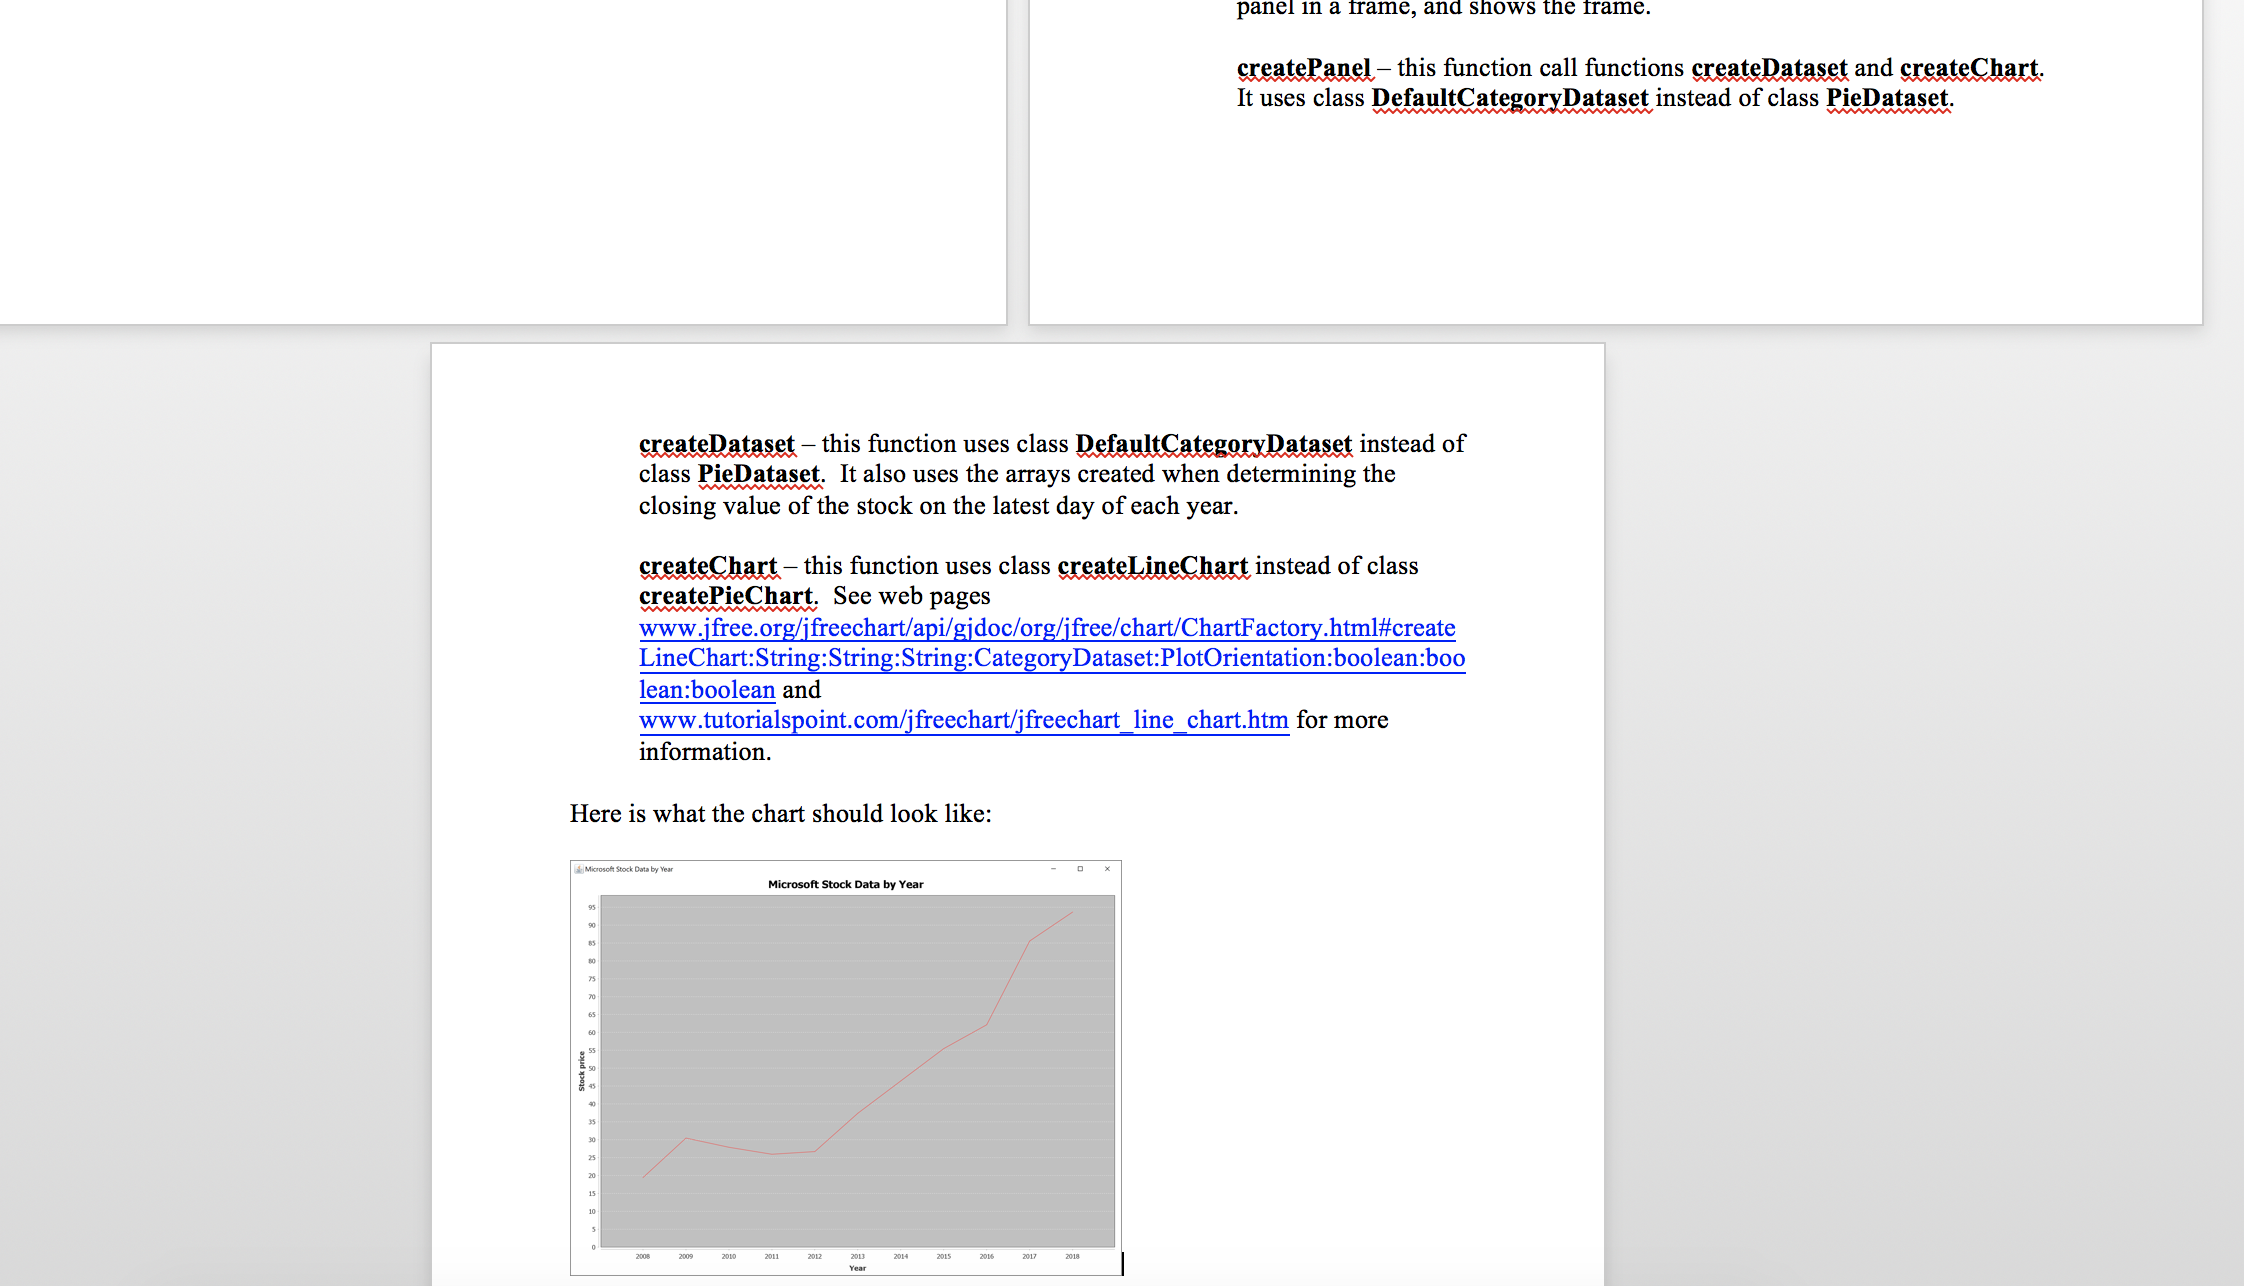
[You've been hired by Microsoft Monarchs to write a Java console application that analyzes their stock data over the past eleven years. Use text le MicrosoftStockData.txt as input to the application. The rst line of the le contains the column headers. The rest of the lines contain daily Microso stock data. Values are separated by commas into the following columns: Column Data type Purpose Date String Trading date Close double Ending share value on that day. Volume int Number of shares traded during that day. Open double Starting share value on that day. High double Highest share value on that day. Low double Lowest share value on that day. Here are the rst ve lines of the le: WM 3/5/2013,93. 64,23737950,92.34,94.27,92.26 3/2/2013, 93. 05,32315660, 91. 53 , 93. 15, 90 . 36 3/1/2013,92.35,36979700,93. 99,94.57,91.34 2/23/2013, 93.77,30011960, 94 . 34, 95,705,93 . 63 The application reads the data into arrays, prints the rst several rows of the data, and then analyzes and charts the data. Create the following mctions: - main 7 this mction denes one array for each column of data in the input le such that there are six parallel arrays. It then calls these functions in sequence: am We. mum. and Wam- - readTextFile 7 this function reads each line of the le, parses it into six columns, and stores each token in its respective array. It skips past the rst line which contains the column headers. - me this function prints two header lines. The rst indicates the range of dates in the data. The second shows the column headers. It then prints the rst twelve lines of the data. Here is sample output: Welcome to Microsoft Monarchs 2,518 data line(s) read from file 'MicrasoftstockData.txt'. First 12 days of data ranging from 3/5/2018-10/9/2017 Date Close Volume Open High Low 3/5/2013 93.64 23,787,950 92.34 94.27 92.26 3/2/2018 93.05 32,815,660 91.58 93.15 90.86 3/1/2018 92.85 36,979,700 93.99 94.57 91.84 2/28/2018 93.77 30,011,960 94.84 95.71 93.63 I me this function determines the following: (1) The date and value of the highest daily stock closing value. (2) The date and value of the lowest daily stock closing value. (33% date and highest difference between the daily high and low stock values. (4) The closing value of the stock on the latest day of each year. For 2018, this is March 5. For each of the other ten years, this is December 31. Store the years and closing values in two parallel arrays. These arrays may then be used to print and chart this data. It then prints the yearly closing values (4) formatted in two columns: I The year. I The closing Q. It then prints the highest (1), lowest (2), and di'erences (3) formatted in three columns: I A label. I A date. I A closing value or difference. Format all real numbers to two decimal places. For the following functions, use the JFreeChart library. This was discussed in the Session 12 Notes. See the Chart drawing sample application on Blackboard. me this function charts the closing value of the stock on the latest day of each year. The chart is a line chart with the year along the xaxis and the stock value along the yaxis. It calls mction WW places the panel in a ame, and shows the frame. me this rnction call functions WW and Wm panel In a name, and SHOWS the name. W- this function call mctions WW and What; It uses class Dgfnglggagggnbatasgt instead of class PieDataget. W- this function uses class We\": instead of class PleDataggt. It also uses the an'ays created when determining the closing value of the stock on the latest day of each year. W this mction uses class Wham of class createPlthm. See web pages www.jfree.orgfreechan/api/gidoc/org'ee/chan/ChanFactory.hhnl#create LineChart:String:String:String:CategoryDataset:PlotOrienmtion:boolean:boo lean:boolean and www.mtoalspoint.com/jeechaIt/jfreechatt line charthtm for more information. Here is what the chart should look like: w_~-~u
Step by Step Solution
There are 3 Steps involved in it

Get step-by-step solutions from verified subject matter experts