

Question: YR15. Do a common size analysis for this balance sheet data Balance Sheet: Industry average and competitors year 15 (BSG, FIR) Industry | % Average
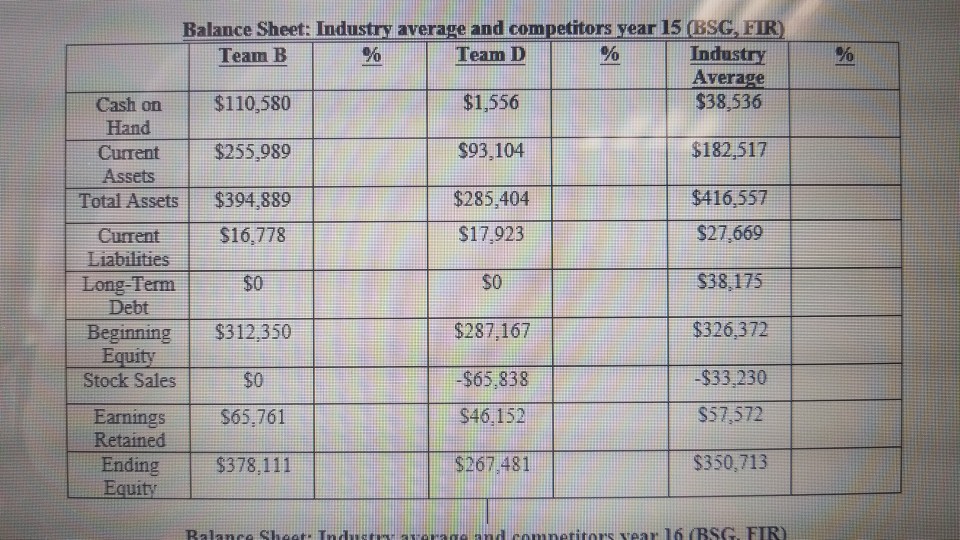
YR15. Do a common size analysis for this balance sheet data
Balance Sheet: Industry average and competitors year 15 (BSG, FIR) Industry | % Average $38,536 Team D $1,556 $93,104 $285,404 $17,923 $O $287,167 -$65,838 $46,152 $267 481 Team B Cash on$110,580 Hand Current$255,989 Assets $182,517 $416,557 $27,669 Total Assets $394,889 Current $16,778 Liabilities Long-Term $38,175 $326,372 $33,230 $57,572 $350,713 $0 Debt Beginning$312,350 Stock Sales$0 Equity Earnings65,761 Retained Ending $378,111 comnetitors vear 16 (RSG, FIR)
Step by Step Solution
There are 3 Steps involved in it
1 Expert Approved Answer
Step: 1 Unlock

Question Has Been Solved by an Expert!
Get step-by-step solutions from verified subject matter experts
Step: 2 Unlock
Step: 3 Unlock