

Question: YUMINR RATE MANAGEMENTS Le FORECAST BASED ON Pppe FORECAST BASED ON INTERNATIONAL OWN FORECAST FORECASTING MODELS RATE the md ON BU co Spot rate 30-6
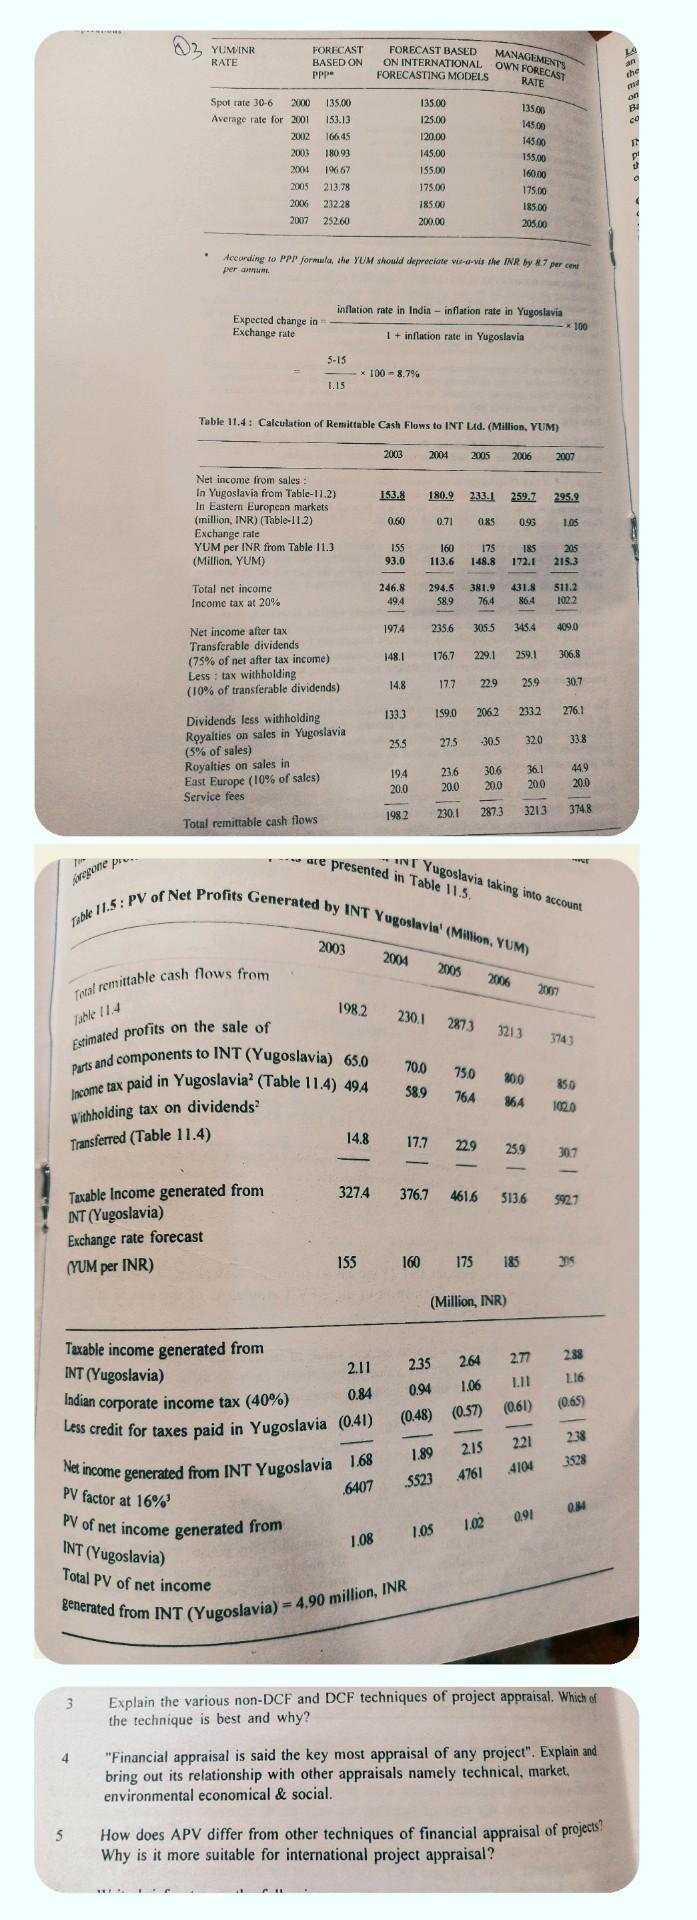
YUMINR RATE MANAGEMENTS Le FORECAST BASED ON Pppe FORECAST BASED ON INTERNATIONAL OWN FORECAST FORECASTING MODELS RATE the md ON BU co Spot rate 30-6 2000 Average rate for 2001 2002 2003 2004 135.00 153.11 166,45 pl 135.00 125.00 120.00 145.00 155.00 175.00 185.00 200.00 180.93 19667 213.78 232.28 252.60 13500 14509 145.00 155.00 160.00 175.00 185.00 205.00 2005 200X 2007 . decording to PPP formula, the YUM should depreciate vis-a-vis the INR by 87 percent per an. Expected change in Exchange rate inflation rate in India - inflation rate in Yugoslavia *100 1 + inflation rate in Yugoslavia S-IS x 100 - 8.7% 1.13 Table 11.4: Calculation of Remittable Cash Flows to INT Lid. (Million, YUM) 2003 2004 2005 2006 2007 153.8 180.9233.1 259.7 295.2 Net income from sales In Yugoslavia from Table-11.2) In Eastern European markets (million, INR) (Table 11.2) Exchange rate YUM per INR from Table 11.3 (Million. YUM) 0.60 0.71 085 093 1.OS 155 93.0 160 113.6 175 148.8 185 172.1 205 215.3 Total net income Income tax at 20% 246.8 49.4 294.5 58.9 381.9 76.4 431.8 86.4 511.2 1022 1974 2356 3055 345.4 409,0 176.7 148.1 229.1 259.1 Net Income after tax Transferable dividends (75% of net after tax income) Less : tax withholding (10% of transferable dividends) 306,8 14.8 17.7 22.9 259 30.7 1333 159.0 2062 2332 276.1 25.5 27.5 -305 32.0 33.8 Dividends less withholding Royalties on sales in Yugoslavia (5% of sales) Royalties on sales in East Europe (10% of sales) Service fees Total remittable cash flows 194 20.0 23.6 20.0 306 200 36.1 200 449 20.0 1982 230.1 287.3 3213 3748 Yugoslavia taking into account presented in Table 11.5. INT Argonte pro Table 11.5: PV of Net Profits Generated by INT Yugoslavia (Million, YUM) 2003 2004 20005 2006 Tocal remittable cash flows from 2009 1982 Table 11.4 230.1 2873 3213 3743 Estimated profits on the sale of Parts and components to INT (Yugoslavia) 65.0 Income tax paid in Yugoslavia? (Table 11.4) 494 70.0 589 750 764 800 864 850 1020 Withholding tax on dividends? Transferred (Table 11.4) 14.8 17.7 229 259 307 - 3274 376.7 461.6 513.6 5927 Taxable income generated from INT (Yugoslavia) Exchange rate forecast (YUM per INR) 155 160 175 185 (Million, INR) 2.11 0.84 288 L16 Taxable income generated from INT (Yugoslavia) Indian corporate income tax (40%) Less credit for taxes paid in Yugoslavia (0.41) Net income generated from INT Yugoslavia 1.68 235 264 277 0.94 1.06 1.11 (0.48) (0.57) (0.61) (0.65) 221 1.89 2.15 238 3528 4104 .4761 .5523 PV factor at 16% .6407 08 PV of net income generated from 091 1.05 1.02 1.08 INT (Yugoslavia) Total PV of net income generated from INT (Yugoslavia) = 4.90 million, INR 3 Explain the various non-DCF and DCF techniques of project appraisal. Which of the technique is best and why? 4 "Financial appraisal is said the key most appraisal of any project". Explain and bring out its relationship with other appraisals namely technical, market. environmental economical & social. 5 How does APV differ from other techniques of financial appraisal of projects? Why is it more suitable for international project appraisal
Step by Step Solution
There are 3 Steps involved in it
1 Expert Approved Answer
Step: 1 Unlock

Question Has Been Solved by an Expert!
Get step-by-step solutions from verified subject matter experts
Step: 2 Unlock
Step: 3 Unlock