

Question: z grade. Question 2 When a bar graph is created using continuous data and the bars shown touch each other, it is called a: O
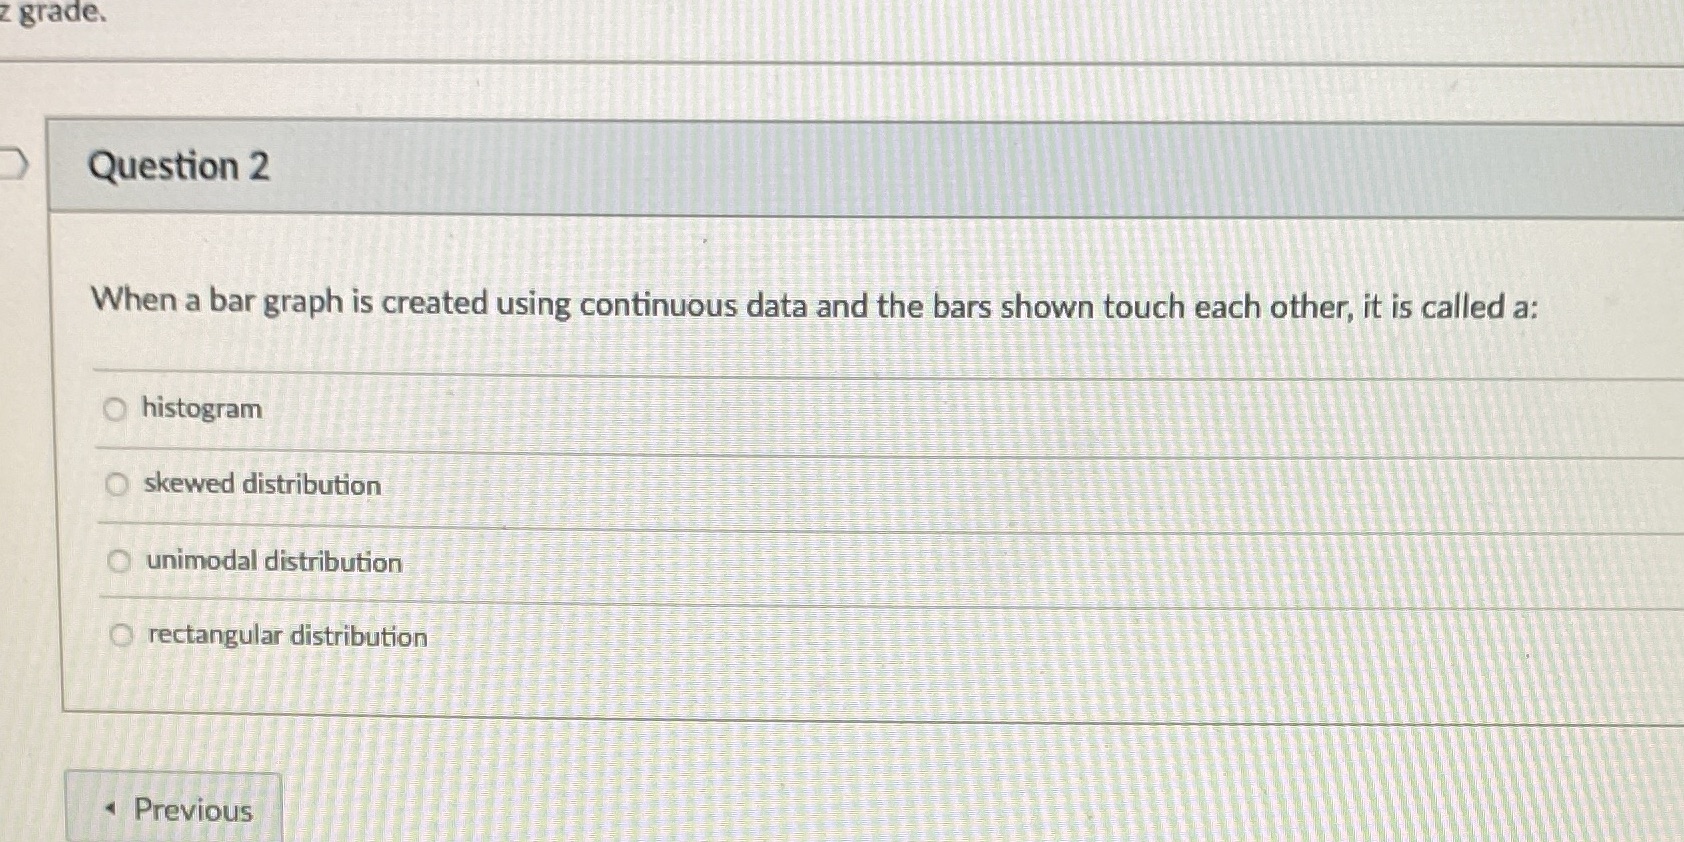
z grade. Question 2 When a bar graph is created using continuous data and the bars shown touch each other, it is called a: O histogram O skewed distribution unimodal distribution rectangular distribution Previous
Step by Step Solution
There are 3 Steps involved in it
1 Expert Approved Answer
Step: 1 Unlock

Question Has Been Solved by an Expert!
Get step-by-step solutions from verified subject matter experts
Step: 2 Unlock
Step: 3 Unlock