

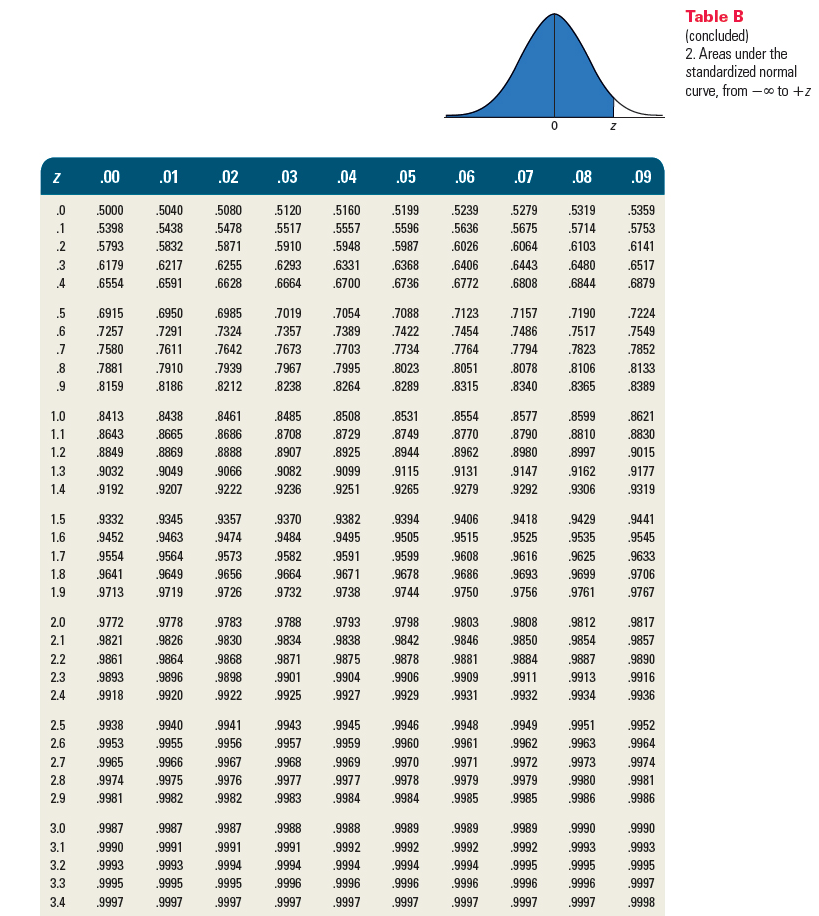
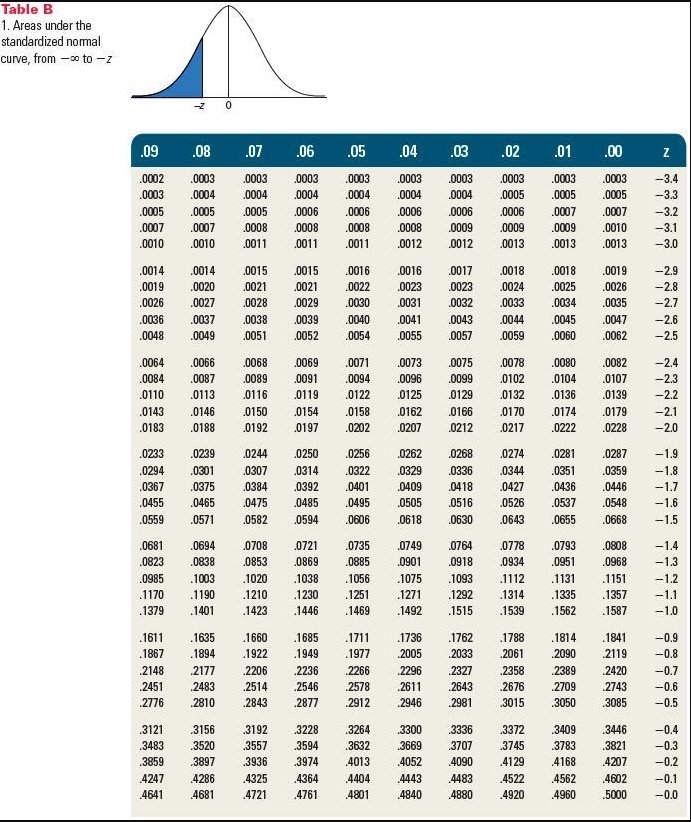
Z N .00 .01 .02 .03 .04 .05 .06 .07 .08 .09 01234 .0 .5000 .5040...
Fantastic news! We've Found the answer you've been seeking!
Question:
Transcribed Image Text:
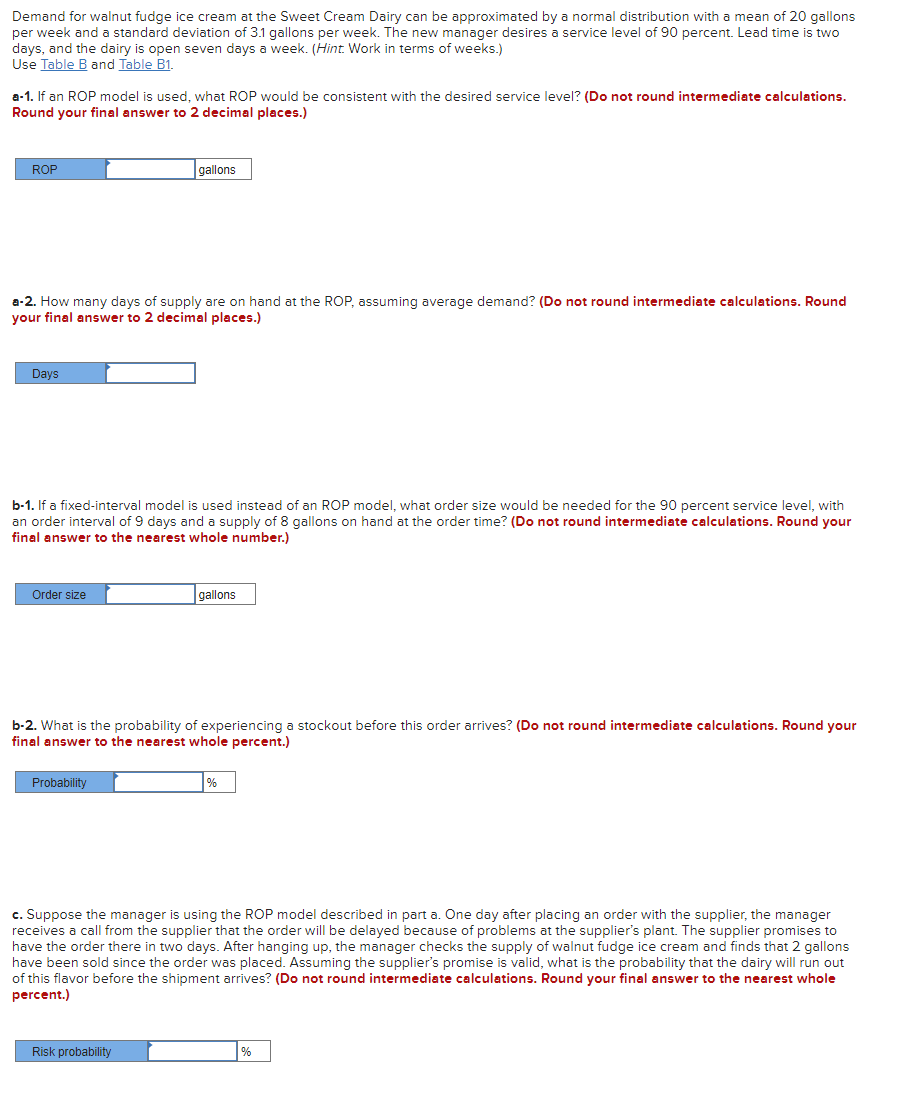
Z N .00 .01 .02 .03 .04 .05 .06 .07 .08 .09 01234 .0 .5000 .5040 .5080 .5120 .5160 .5199 .5239 .5279 .5319 .5359 .1 .5398 .5438 .5478 .5517 .5557 .5596 .5636 .5675 .5714 .5753 .2 .5793 .5832 .5871 .5910 .5948 .5987 .6026 .6064 .6103 .6141 .6179 .6217 .6255 .6293 .6331 .6368 .6406 .6443 .6480 .6517 .6554 .6591 .6628 .6664 .6700 .6736 .6772 .6808 .6844 .6879 .9 5698 .6915 .6950 .6985 .7019 .7054 .7088 .7123 .7157 .7190 .7224 .7257 .7291 .7324 .7357 .7389 .7422 .7454 .7486 .7517 .7549 .7580 .7611 .7642 .7673 .7703 .7734 .7764 .7794 .7823 .7852 .7881 .7910 .7939 .7967 .7995 .8023 .8051 .8078 .8106 .8133 .8159 .8186 .8212 .8238 .8264 .8289 .8315 .8340 .8365 .8389 1.1 1.2 1.4 FREE 1.0 .8413 .8438 .8461 .8485 .8508 .8531 .8554 .8577 .8599 .8621 .8643 .8665 .8686 .8708 .8729 .8749 .8770 .8790 .8810 .8830 .8849 .8869 .8888 .8907 .8925 .8944 .8962 .8980 .8997 .9015 1.3 .9032 .9049 .9066 .9082 .9099 .9115 .9131 .9147 .9162 .9177 .9192 .9207 .9222 .9236 .9251 .9265 .9279 .9292 .9306 .9319 1.5 .9332 .9345 .9357 .9370 .9382 .9394 .9406 .9418 .9429 .9441 1.6 .9452 .9463 .9474 .9484 .9495 .9505 .9515 .9525 .9535 .9545 1.7 .9554 .9564 .9573 .9582 .9591 .9599 .9608 .9616 .9625 .9633 1.8 .9641 .9649 .9656 .9664 .9671 .9678 .9686 .9693 .9699 .9706 1.9 .9713 .9719 .9726 .9732 .9738 .9744 .9750 .9756 .9761 .9767 22222 22222 8 2.0 .9772 .9778 .9783 .9788 .9793 .9798 .9803 .9808 .9812 .9817 2.1 .9821 .9826 .9830 .9834 .9838 .9842 .9846 .9850 .9854 .9857 .9861 .9864 .9868 .9871 .9875 .9878 .9881 .9884 .9887 .9890 2.3 .9893 .9896 .9898 .9901 .9904 .9906 .9909 .9911 .9913 .9916 2.4 .9918 .9920 .9922 .9925 .9927 .9929 .9931 .9932 .9934 .9936 2.5 .9938 .9940 .9941 .9943 .9945 .9946 .9948 .9949 .9951 .9952 2.6 .9953 .9955 .9956 .9957 .9959 .9960 .9961 .9962 .9963 .9964 2.7 .9965 .9966 .9967 .9968 .9969 .9970 .9971 .9972 .9973 .9974 .9974 .9975 .9976 .9977 .9977 .9978 .9979 .9979 .9980 .9981 2.9 .9981 .9982 .9982 .9983 .9984 .9984 .9985 .9985 .9986 .9986 3.0 .9987 .9987 .9987 .9988 .9988 .9989 .9989 .9989 .9990 .9990 3.1 .9990 .9991 .9991 .9991 .9992 .9992 .9992 .9992 .9993 .9993 3.2 .9993 .9993 .9994 .9994 .9994 .9994 .9994 .9995 .9995 .9995 3.3 .9995 .9995 .9995 .9996 .9996 .9996 .9996 .9996 .9996 .9997 3.4 .9997 .9997 .9997 .9997 .9997 .9997 .9997 .9997 .9997 .9998 Table B (concluded) 2. Areas under the standardized normal curve, from - to +z Table B 1. Areas under the standardized normal curve, from - to -z .09 .08 .07 .06 .05 .04 .03 80 .02 .01 .00 Z .0002 .0003 .0003 .0003 .0003 .0003 .0003 .0003 .0003 .0003 -3.4 .0003 .0004 .0004 .0004 .0004 .0004 .0004 .0005 .0005 .0005 -3.3 .0005 .0005 .0005 .0006 .0006 .0006 .0006 .0006 .0007 .0007 -3.2 .0007 .0007 .0008 .0008 .0008 .0008 .0009 .0009 .0009 .0010 -3.1 .0010 .0010 .0011 .0011 .0011 .0012 .0012 .0013 .0013 .0013 -3.0 .0014 .0014 .0015 .0015 .0016 .0016 .0017 .0018 .0018 .0019 -2.9 .0019 .0020 .0021 .0021 .0022 .0023 .0023 .0024 .0025 .0026 -2.8 .0026 .0027 .0028 .0029 .0030 .0031 .0032 .0033 .0034 .0035 -2.7 .0036 .0037 .0038 .0039 .0040 .0041 .0043 .0044 .0045 .0047 -2.6 .0048 .0049 .0051 .0052 .0054 .0055 .0057 .0059 .0060 .0062 -2.5 .0064 .0066 .0068 .0069 .0071 .0073 .0075 .0078 .0080 .0082 -2.4 .0084 .0087 .0089 .0091 .0094 .0096 .0099 .0102 .0104 .0107 -2.3 .0110 .0113 .0116 .0119 .0122 .0125 .0129 .0132 .0136 .0139 -2.2 .0143 .0146 .0150 .0154 .0158 .0162 .0166 .0170 .0174 .0179 -2.1 .0183 .0188 0192 .0197 .0202 .0207 .0212 .0217 .0222 .0228 -2.0 .0233 .0239 .0244 .0250 .0256 .0262 .0268 .0274 .0281 .0287 -1.9 .0294 .0301 .0307 .0314 .0322 .0329 .0336 .0344 .0351 .0359 -1.8 .0367 .0375 .0384 .0392 .0401 .0409 .0418 .0427 .0436 .0446 -1.7 .0455 .0465 .0475 .0485 .0495 .0505 .0516 .0526 .0537 .0548 -1.6 .0559 .0571 .0582 .0594 .0606 .0618 .0630 .0643 .0655 .0668 -1.5 .0681 .0694 .0708 .0721 .0735 .0749 .0764 .0778 .0793 .0808 -1.4 .0823 .0838 .0853 .0869 .0885 .0901 .0918 .0934 .0951 .0968 -1.3 .0985 .1003 .1020 .1038 .1056 .1075 .1093 .1112 .1131 .1151 -1.2 .1170 .1190 .1210 .1230 .1251 .1271 .1292 .1314 .1335 .1357 -1.1 .1379 .1401 .1423 .1446 .1469 .1492 .1515 .1539 .1562 .1587 -1.0 .1611 .1635 .1660 .1685 .1711 .1736 .1762 .1788 .1814 .1841 -0.9 .1867 .1894 .1922 .1949 .1977 .2005 .2033 .2061 .2090 .2119 -0.8 .2148 .2177 .2206 .2236 .2266 .2296 .2327 .2358 .2389 2420 -0.7 .2451 .2483 .2514 .2546 .2578 .2611 .2643 .2676 .2709 .2743 -0.6 .2776 2810 .2843 .2877 .2912 .2946 2981 .3015 .3050 .3085 -0.5 .3121 .3156 .3192 .3228 3264 .3300 3336 .3372 .3409 .3446 -0.4 .3483 .3520 .3557 .3594 .3632 .3669 .3707 .3745 .3783 .3821 -0.3 .3859 .3897 .3936 .3974 .4013 .4052 .4090 .4129 .4168 .4207 -0.2 .4247 .4286 .4325 .4364 .4404 .4443 .4483 .4522 .4562 .4602 -0.1 .4641 .4681 .4721 .4761 .4801 .4840 .4880 .4920 .4960 .5000 -0.0 Demand for walnut fudge ice cream at the Sweet Cream Dairy can be approximated by a normal distribution with a mean of 20 gallons per week and a standard deviation of 3.1 gallons per week. The new manager desires a service level of 90 percent. Lead time is two days, and the dairy is open seven days a week. (Hint. Work in terms of weeks.) Use Table B and Table B1. a-1. If an ROP model is used, what ROP would be consistent with the desired service level? (Do not round intermediate calculations. Round your final answer to 2 decimal places.) ROP gallons a-2. How many days of supply are on hand at the ROP, assuming average demand? (Do not round intermediate calculations. Round your final answer to 2 decimal places.) Days b-1. If a fixed-interval model is used instead of an ROP model, what order size would be needed for the 90 percent service level, with an order interval of 9 days and a supply of 8 gallons on hand at the order time? (Do not round intermediate calculations. Round your final answer to the nearest whole number.) Order size gallons b-2. What is the probability of experiencing a stockout before this order arrives? (Do not round intermediate calculations. Round your final answer to the nearest whole percent.) Probability % c. Suppose the manager is using the ROP model described in part a. One day after placing an order with the supplier, the manager receives a call from the supplier that the order will be delayed because of problems at the supplier's plant. The supplier promises to have the order there in two days. After hanging up, the manager checks the supply of walnut fudge ice cream and finds that 2 gallons have been sold since the order was placed. Assuming the supplier's promise is valid, what is the probability that the dairy will run out of this flavor before the shipment arrives? (Do not round intermediate calculations. Round your final answer to the nearest whole percent.) Risk probability % Z N .00 .01 .02 .03 .04 .05 .06 .07 .08 .09 01234 .0 .5000 .5040 .5080 .5120 .5160 .5199 .5239 .5279 .5319 .5359 .1 .5398 .5438 .5478 .5517 .5557 .5596 .5636 .5675 .5714 .5753 .2 .5793 .5832 .5871 .5910 .5948 .5987 .6026 .6064 .6103 .6141 .6179 .6217 .6255 .6293 .6331 .6368 .6406 .6443 .6480 .6517 .6554 .6591 .6628 .6664 .6700 .6736 .6772 .6808 .6844 .6879 .9 5698 .6915 .6950 .6985 .7019 .7054 .7088 .7123 .7157 .7190 .7224 .7257 .7291 .7324 .7357 .7389 .7422 .7454 .7486 .7517 .7549 .7580 .7611 .7642 .7673 .7703 .7734 .7764 .7794 .7823 .7852 .7881 .7910 .7939 .7967 .7995 .8023 .8051 .8078 .8106 .8133 .8159 .8186 .8212 .8238 .8264 .8289 .8315 .8340 .8365 .8389 1.1 1.2 1.4 FREE 1.0 .8413 .8438 .8461 .8485 .8508 .8531 .8554 .8577 .8599 .8621 .8643 .8665 .8686 .8708 .8729 .8749 .8770 .8790 .8810 .8830 .8849 .8869 .8888 .8907 .8925 .8944 .8962 .8980 .8997 .9015 1.3 .9032 .9049 .9066 .9082 .9099 .9115 .9131 .9147 .9162 .9177 .9192 .9207 .9222 .9236 .9251 .9265 .9279 .9292 .9306 .9319 1.5 .9332 .9345 .9357 .9370 .9382 .9394 .9406 .9418 .9429 .9441 1.6 .9452 .9463 .9474 .9484 .9495 .9505 .9515 .9525 .9535 .9545 1.7 .9554 .9564 .9573 .9582 .9591 .9599 .9608 .9616 .9625 .9633 1.8 .9641 .9649 .9656 .9664 .9671 .9678 .9686 .9693 .9699 .9706 1.9 .9713 .9719 .9726 .9732 .9738 .9744 .9750 .9756 .9761 .9767 22222 22222 8 2.0 .9772 .9778 .9783 .9788 .9793 .9798 .9803 .9808 .9812 .9817 2.1 .9821 .9826 .9830 .9834 .9838 .9842 .9846 .9850 .9854 .9857 .9861 .9864 .9868 .9871 .9875 .9878 .9881 .9884 .9887 .9890 2.3 .9893 .9896 .9898 .9901 .9904 .9906 .9909 .9911 .9913 .9916 2.4 .9918 .9920 .9922 .9925 .9927 .9929 .9931 .9932 .9934 .9936 2.5 .9938 .9940 .9941 .9943 .9945 .9946 .9948 .9949 .9951 .9952 2.6 .9953 .9955 .9956 .9957 .9959 .9960 .9961 .9962 .9963 .9964 2.7 .9965 .9966 .9967 .9968 .9969 .9970 .9971 .9972 .9973 .9974 .9974 .9975 .9976 .9977 .9977 .9978 .9979 .9979 .9980 .9981 2.9 .9981 .9982 .9982 .9983 .9984 .9984 .9985 .9985 .9986 .9986 3.0 .9987 .9987 .9987 .9988 .9988 .9989 .9989 .9989 .9990 .9990 3.1 .9990 .9991 .9991 .9991 .9992 .9992 .9992 .9992 .9993 .9993 3.2 .9993 .9993 .9994 .9994 .9994 .9994 .9994 .9995 .9995 .9995 3.3 .9995 .9995 .9995 .9996 .9996 .9996 .9996 .9996 .9996 .9997 3.4 .9997 .9997 .9997 .9997 .9997 .9997 .9997 .9997 .9997 .9998 Table B (concluded) 2. Areas under the standardized normal curve, from - to +z Table B 1. Areas under the standardized normal curve, from - to -z .09 .08 .07 .06 .05 .04 .03 80 .02 .01 .00 Z .0002 .0003 .0003 .0003 .0003 .0003 .0003 .0003 .0003 .0003 -3.4 .0003 .0004 .0004 .0004 .0004 .0004 .0004 .0005 .0005 .0005 -3.3 .0005 .0005 .0005 .0006 .0006 .0006 .0006 .0006 .0007 .0007 -3.2 .0007 .0007 .0008 .0008 .0008 .0008 .0009 .0009 .0009 .0010 -3.1 .0010 .0010 .0011 .0011 .0011 .0012 .0012 .0013 .0013 .0013 -3.0 .0014 .0014 .0015 .0015 .0016 .0016 .0017 .0018 .0018 .0019 -2.9 .0019 .0020 .0021 .0021 .0022 .0023 .0023 .0024 .0025 .0026 -2.8 .0026 .0027 .0028 .0029 .0030 .0031 .0032 .0033 .0034 .0035 -2.7 .0036 .0037 .0038 .0039 .0040 .0041 .0043 .0044 .0045 .0047 -2.6 .0048 .0049 .0051 .0052 .0054 .0055 .0057 .0059 .0060 .0062 -2.5 .0064 .0066 .0068 .0069 .0071 .0073 .0075 .0078 .0080 .0082 -2.4 .0084 .0087 .0089 .0091 .0094 .0096 .0099 .0102 .0104 .0107 -2.3 .0110 .0113 .0116 .0119 .0122 .0125 .0129 .0132 .0136 .0139 -2.2 .0143 .0146 .0150 .0154 .0158 .0162 .0166 .0170 .0174 .0179 -2.1 .0183 .0188 0192 .0197 .0202 .0207 .0212 .0217 .0222 .0228 -2.0 .0233 .0239 .0244 .0250 .0256 .0262 .0268 .0274 .0281 .0287 -1.9 .0294 .0301 .0307 .0314 .0322 .0329 .0336 .0344 .0351 .0359 -1.8 .0367 .0375 .0384 .0392 .0401 .0409 .0418 .0427 .0436 .0446 -1.7 .0455 .0465 .0475 .0485 .0495 .0505 .0516 .0526 .0537 .0548 -1.6 .0559 .0571 .0582 .0594 .0606 .0618 .0630 .0643 .0655 .0668 -1.5 .0681 .0694 .0708 .0721 .0735 .0749 .0764 .0778 .0793 .0808 -1.4 .0823 .0838 .0853 .0869 .0885 .0901 .0918 .0934 .0951 .0968 -1.3 .0985 .1003 .1020 .1038 .1056 .1075 .1093 .1112 .1131 .1151 -1.2 .1170 .1190 .1210 .1230 .1251 .1271 .1292 .1314 .1335 .1357 -1.1 .1379 .1401 .1423 .1446 .1469 .1492 .1515 .1539 .1562 .1587 -1.0 .1611 .1635 .1660 .1685 .1711 .1736 .1762 .1788 .1814 .1841 -0.9 .1867 .1894 .1922 .1949 .1977 .2005 .2033 .2061 .2090 .2119 -0.8 .2148 .2177 .2206 .2236 .2266 .2296 .2327 .2358 .2389 2420 -0.7 .2451 .2483 .2514 .2546 .2578 .2611 .2643 .2676 .2709 .2743 -0.6 .2776 2810 .2843 .2877 .2912 .2946 2981 .3015 .3050 .3085 -0.5 .3121 .3156 .3192 .3228 3264 .3300 3336 .3372 .3409 .3446 -0.4 .3483 .3520 .3557 .3594 .3632 .3669 .3707 .3745 .3783 .3821 -0.3 .3859 .3897 .3936 .3974 .4013 .4052 .4090 .4129 .4168 .4207 -0.2 .4247 .4286 .4325 .4364 .4404 .4443 .4483 .4522 .4562 .4602 -0.1 .4641 .4681 .4721 .4761 .4801 .4840 .4880 .4920 .4960 .5000 -0.0 Demand for walnut fudge ice cream at the Sweet Cream Dairy can be approximated by a normal distribution with a mean of 20 gallons per week and a standard deviation of 3.1 gallons per week. The new manager desires a service level of 90 percent. Lead time is two days, and the dairy is open seven days a week. (Hint. Work in terms of weeks.) Use Table B and Table B1. a-1. If an ROP model is used, what ROP would be consistent with the desired service level? (Do not round intermediate calculations. Round your final answer to 2 decimal places.) ROP gallons a-2. How many days of supply are on hand at the ROP, assuming average demand? (Do not round intermediate calculations. Round your final answer to 2 decimal places.) Days b-1. If a fixed-interval model is used instead of an ROP model, what order size would be needed for the 90 percent service level, with an order interval of 9 days and a supply of 8 gallons on hand at the order time? (Do not round intermediate calculations. Round your final answer to the nearest whole number.) Order size gallons b-2. What is the probability of experiencing a stockout before this order arrives? (Do not round intermediate calculations. Round your final answer to the nearest whole percent.) Probability % c. Suppose the manager is using the ROP model described in part a. One day after placing an order with the supplier, the manager receives a call from the supplier that the order will be delayed because of problems at the supplier's plant. The supplier promises to have the order there in two days. After hanging up, the manager checks the supply of walnut fudge ice cream and finds that 2 gallons have been sold since the order was placed. Assuming the supplier's promise is valid, what is the probability that the dairy will run out of this flavor before the shipment arrives? (Do not round intermediate calculations. Round your final answer to the nearest whole percent.) Risk probability %
Expert Answer:

Related Book For 

Elementary Statistics A Step By Step Approach
ISBN: 9780077665807
9th Edition
Authors: Allan G. Bluman
Posted Date:
Students also viewed these general management questions
-
3. For each of the following, select the demand curve that would be MORE elastic. a) Demand for Carrots or Demand for Cigarettes b) Demand for Coca-Cola beverages or Demand for Diet Coke c) A less...
-
A mileage test is conducted for a new car model, the "Pizzazz." Thirty (n-30) random selected Pizzazzes are driven for a month and the mileage is carefully measured in each. The mean mileage for the...
-
Consider the 70 households that purchased a DVD player, 48 households are satisfied with their purchase and 22 households are dissatisfied. Suppose two households are randomly selected from the...
-
(Appendix) Describe the components of the Scott formula.
-
A solution contains 0.102 mol Ca(NO 3 ) 2 and 0.927 mol H 2 O. Calculate the vapor pressure of the solution at 55 C. The vapor pressure of pure water at 55 C is 118.1 torr. (Assume that the solute...
-
The balance sheet and income statement for the Papua New Guinea Coconut Company are as follows: Income Statement ($000) Balance Sheet (5000) Cash Accounts receivable Inventories $ 550 2,500 1.100...
-
Moonlight Bay Inn is incorporated on January 2, 2010, by its three owners, each of whom contributes $20,000 in cash in exchange for shares of stock in the business. In addition to the sale of stock,...
-
6. Consider two G.P.'s. 2, 22, 23, and 4, 4, 4, of 60 and n terms respectively. If the 225 n geometric mean of all the 60 + n terms is (2), then k(n-k) is equal to: (a) 560 (b) 1540 (c) 1330 (d) 2600
-
A 16-kW, 1500-rpm electric motor drives a machine through multiple V-belts. The V-belts used have a unit weight of 0.214 kg/m. The sheave on the motor shaft has a 94 mm pitch diameter and the angle...
-
Shattered Glass plc is an all-equity firm. The cost of the companys equity is currently 22 per cent, and the risk-free rate is 3 per cent. The company is currently considering a project that will...
-
Daniel Kaffe, CFO of Kendrick Enterprises, is evaluating a 6-year, 13 per cent loan with gross proceeds of 9,000,000. The interest payments on the loan will be made annually. Flotation costs are...
-
Cryo NV is an all-equity firm involved in property and casualty insurance. However, Cryo is about to issue a 10-year bond issued at par with a coupon of 8 per cent. Prior to the bond issue, the firm...
-
Given the following information for Huntington Power, find the WACC. Assume the companys tax rate is 28 per cent. Debt: Equity: Market: 40,000 7 per cent coupon bonds outstanding, 100 par value, 20...
-
If Wild Widgets were an all-equity company, it would have a beta of 1.1. The company has a target debtequity ratio of 0.40. The expected return on the market portfolio is 13 per cent, and Treasury...
-
What would be the best way or combination of ways to educate your employees about the acquisition? Oral media, written media, visual media and/or electronic media?
-
Refer to the table to answer the following questions. Year Nominal GDP (in billions) Total Federal Spending (in billions) Real GDP (in billions) Real Federal Spending (in billions) 2000 9,817 578...
-
In IRC 280A(c)(1)(A), what labels are used for the subparts?
-
What is included in the administrative sources of tax law?
-
Maverick and Melanie Hall are selling their current home and purchasing another larger home for their growing family. You will review a list of improvements provided by the Halls, and the settlement...

Study smarter with the SolutionInn App