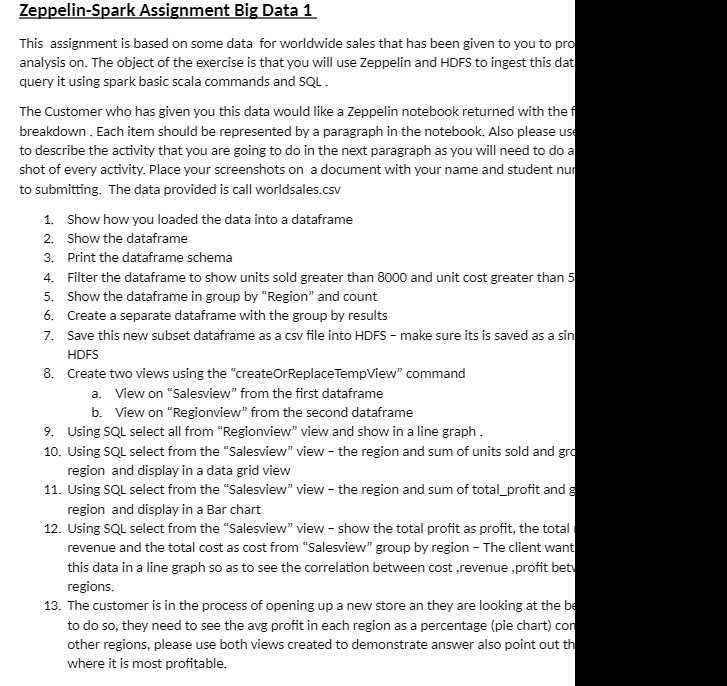
Question: Zeppelin-Spark Assignment Big Data 1 This assignment is based on some data for worldwide sales that has been given to you to p analysis on.

Zeppelin-Spark Assignment Big Data 1 This
Zeppelin-Spark Assignment Big Data 1 This assignment is based on some data for worldwide sales that has been given to you to p analysis on. The object of the exercise is that you will use Eep pelin and HDFS to ingest this cl query it using spark basic scala commands and SQL . \"the Customer who has given you this data would like a zeppelin notebook returned with the breakdown . Each item should be represented by a paragraph in the notebook Also please u to describe the activity that you are going to do in the next paragraph as you will need to do a shot of every activity. Place your screenshots on a document with your name and student nu to submitting. The data provided is call worldsales.csv Show how you loaded the data into a dataframe Show the datafra me Print the datafra me schema Filter the datafra me to show units sold greater than 8000 and unit cost greater than 5 Show the dataframe in group by "Region" and count Create a separate datafra me with the group by results HPWP'WHH Save this new subset dataframe as a csv le into HDFS make sure its is saved as a sin HDFS 8. Create two views using the "createDrReplaceTem p'v'iew" co mmand a. 'v'iew on \"Salesview\" from the rst dataframe b. View on r'iniegionview\" from the second dataframe 9. Using SQL select all from "Regio nview" view and show in a line graph . 10. Using SQL select from the "Salesview"I view the region and sum of units sold and gr region and display in a data grid view 11. Using SQL select from the "Salesview" view the region and sum of total_prot and region and display in a Bar chart 12. Using SQL select from the "Salesview"I view show the total prot as prot. the total revenue and the total cost as cost from "Salesview" group by region The client want this data in a line graph so as to see the correlation between cost ,revenue ,prot be regions. 13. \"the customer is in the process of opening up a new store an they are looking at the b to do so, they need to see the avg prot in each region as a percentage [pie chart} co other regions, please use both views created to demonstrate answer also point out where it is most protable

Step by Step Solution

There are 3 Steps involved in it

1 Expert Approved Answer
Step: 1 Unlock blur-text-image
Question Has Been Solved by an Expert!

Get step-by-step solutions from verified subject matter experts

Step: 2 Unlock
Step: 3 Unlock

Students Have Also Explored These Related Mathematics Questions!