

Question: Zoom Add Page Insert Table Chart Text Shape Media Comment Colla Time (days) BOD (mg/liter) Minitab output resulting from fitting a simple linear regression model
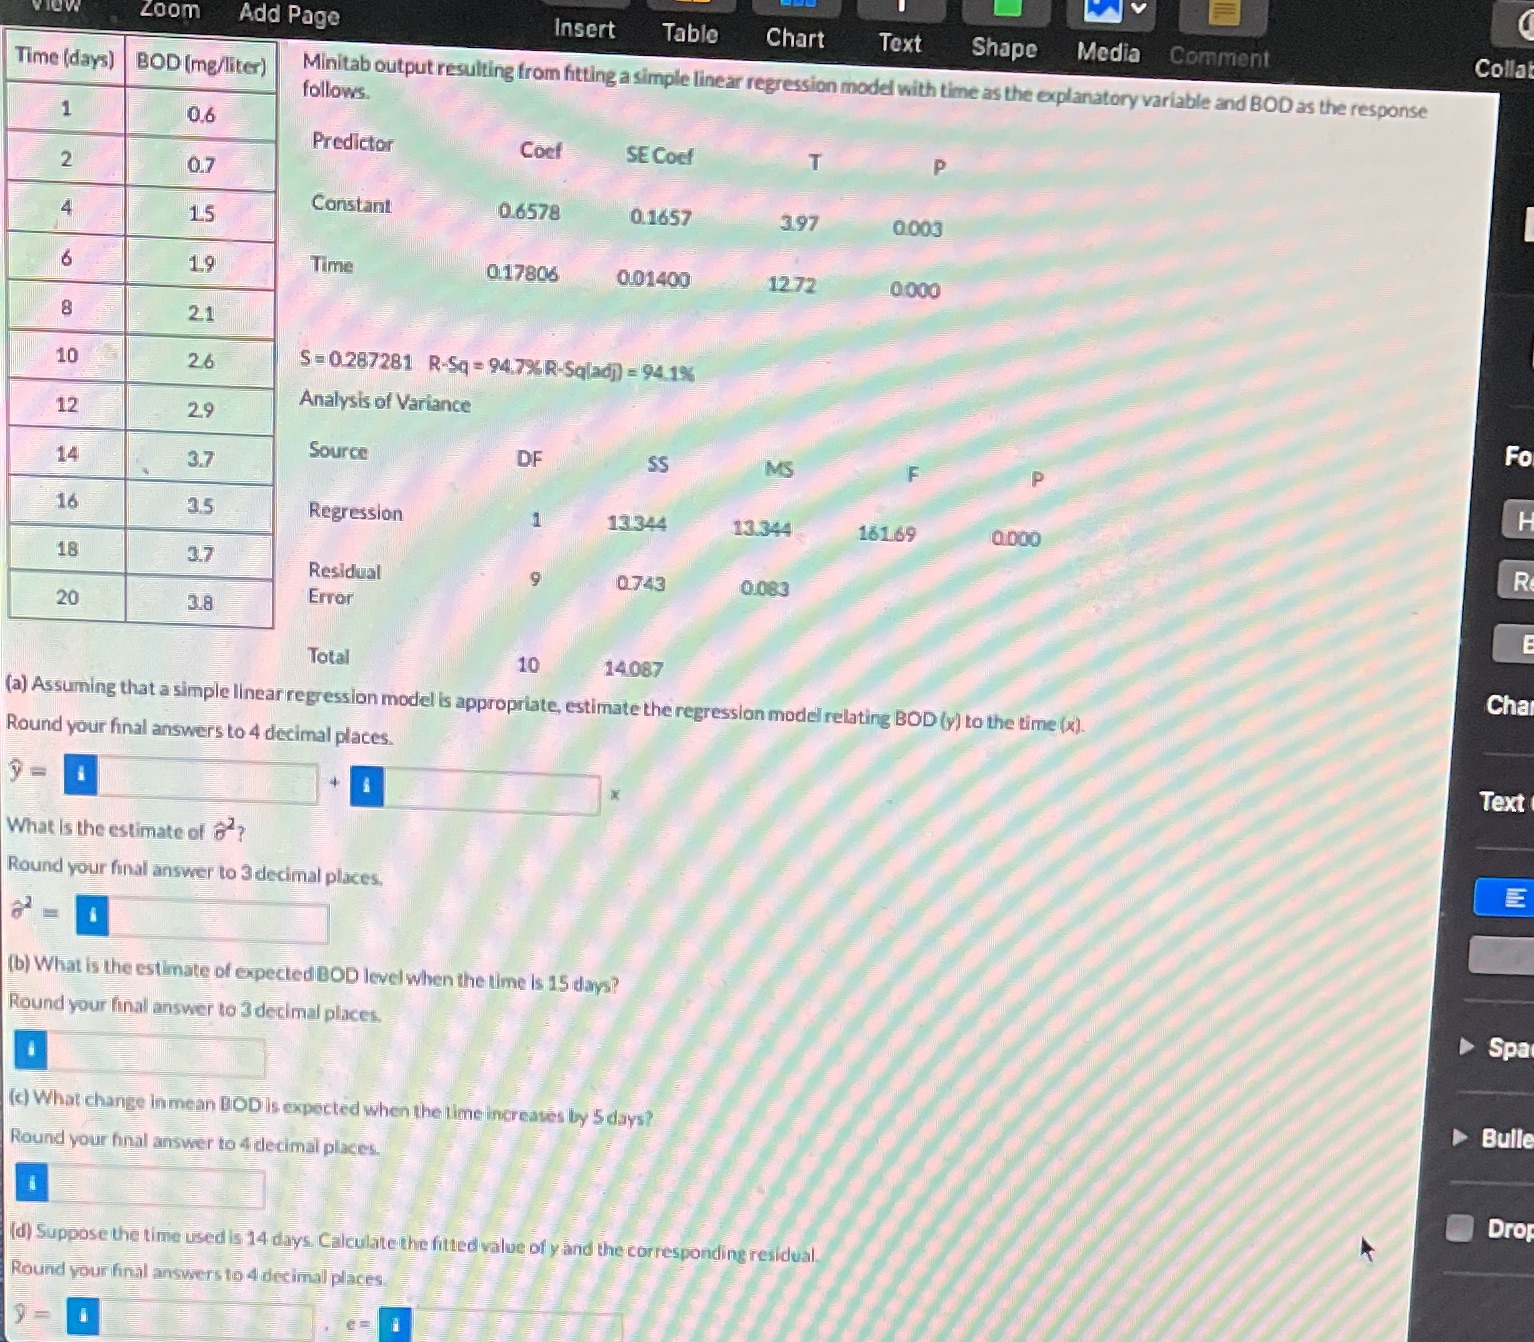
Zoom Add Page Insert Table Chart Text Shape Media Comment Colla Time (days) BOD (mg/liter) Minitab output resulting from fitting a simple linear regression model with time as the explanatory variable and BOD as the response follows. 0.6 Predictor Cool SE Coof 2 0.7 Constant 0.6578 0.1657 3.97 0.003 15 61 19 Time 0.17806 0101400 12 72 0:000 21 10 26 S = 0.287281 R-Sq = 94.7%R-Sqladj) = 94.1% Analysis of Variance 12 29 Fo Source DF SS MS 14 3.7 16 3.5 Regression 13 344 13.344 161.69 Q.DO0 R 18 3.7 Residual 0743 0.083 20 3.8 Error Total 10 14087 Cha (a) Assuming that a simple linear regression model is appropriate, estimate the regression model relating BOD (y) to the time (x). Round your final answers to 4 decimal places. Text What Is the estimate of 8"? E Round your final answer to 3 decimal places. (b) What is the estimate of expected BOD level when the time Is 15 days? Round your final answer to 3 decimal places. Bulle (
Step by Step Solution
There are 3 Steps involved in it

Get step-by-step solutions from verified subject matter experts