

Question: zoom it 3 day Forecasting Student Appointments It is time for advising and the undergraduate office needs to plan for demand for services. The staff
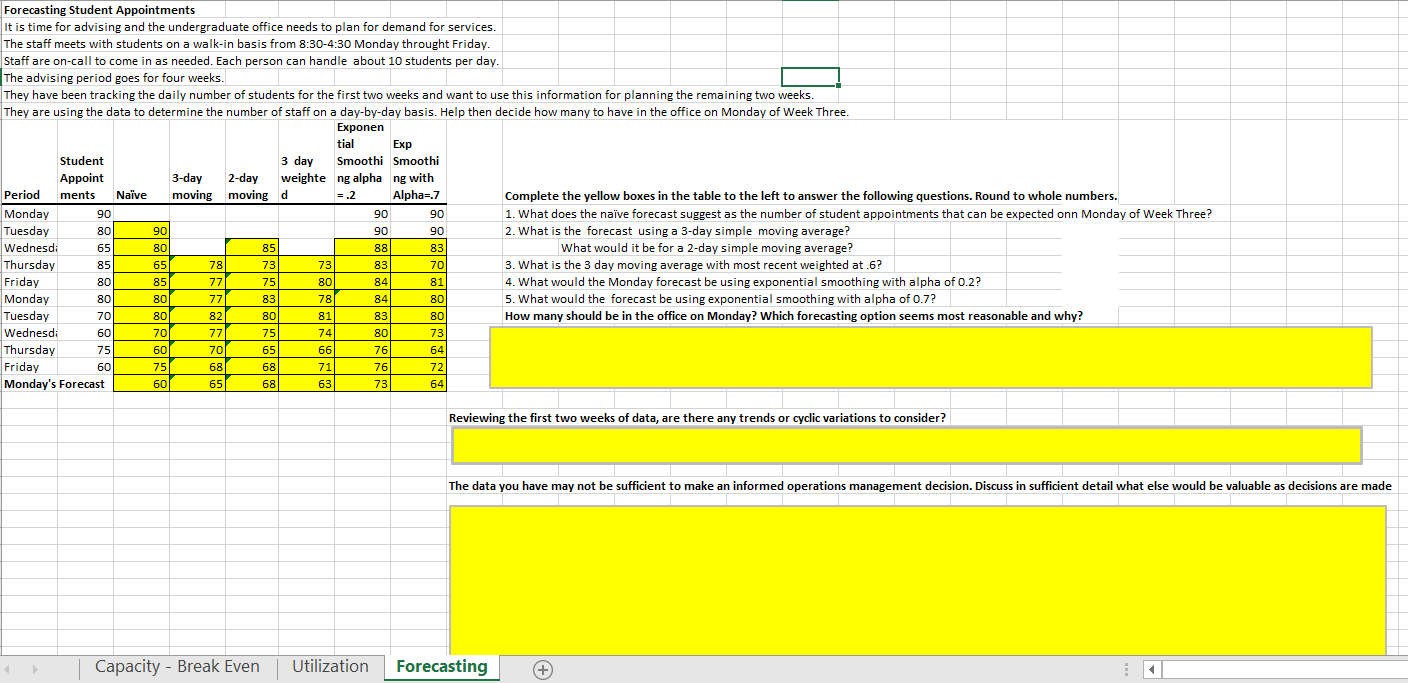
3 day Forecasting Student Appointments It is time for advising and the undergraduate office needs to plan for demand for services. The staff meets with students on a walk-in basis from 8:30-4:30 Monday throught Friday. Staff are on-call to come in as needed. Each person can handle about 10 students per day. The advising period goes for four weeks. They have been tracking the daily number of students for the first two weeks and want to use this information for planning the remaining two weeks. They are using the data to determine the number of staff on a day-by-day basis. Help then decide how many to have in the office on Monday of Week Three. Exponen tial Exp Student Smoothi Smoothi Appoint 3-day 2-day weighte ng alpha ng with Period ments Nave moving moving d = 2 Alpha=.7 Complete the yellow boxes in the table to the left to answer the following questions. Round to whole numbers. Monday 90 90 90 1. What does the nave forecast suggest as the number of student appointments that can be expected on Monday of Week Three? Tuesday 80 90 90 90 2. What is the forecast using a 3-day simple moving average? Wednesdi 65 80 85 88 83 What would it be for a 2-day simple moving average? Thursday 85 65 78 73 73 83 70 3. What is the 3 day moving average with most recent weighted at..? 80 85 77 4. What would the Monday forecast be using exponential smoothing with alpha of 0.2? Monday 80 80 77 83 78 84 80 5. What would the forecast be using exponential smoothing with alpha of 0.7? Tuesday 70 80 82 80 81 83 80 How many should be in the office on Monday? Which forecasting option seems most reasonable and why? Wednesdi 60 70 77 75 74 80 73 Thursday 75 60 701 65 66 76 64 Friday 60 75 68 68 71 76 72 Monday's Forecast 60 65 68 63 73 64 Friday 75 80 84 81 Reviewing the first two weeks of data, are there any trends or cyclic variations to consider? The data you have may not be sufficient to make an informed operations management decision. Discuss in sufficient detail what else would be valuable as decisions are made Capacity - Break Even Utilization Forecasting 3 day Forecasting Student Appointments It is time for advising and the undergraduate office needs to plan for demand for services. The staff meets with students on a walk-in basis from 8:30-4:30 Monday throught Friday. Staff are on-call to come in as needed. Each person can handle about 10 students per day. The advising period goes for four weeks. They have been tracking the daily number of students for the first two weeks and want to use this information for planning the remaining two weeks. They are using the data to determine the number of staff on a day-by-day basis. Help then decide how many to have in the office on Monday of Week Three. Exponen tial Exp Student Smoothi Smoothi Appoint 3-day 2-day weighte ng alpha ng with Period ments Nave moving moving d = 2 Alpha=.7 Complete the yellow boxes in the table to the left to answer the following questions. Round to whole numbers. Monday 90 90 90 1. What does the nave forecast suggest as the number of student appointments that can be expected on Monday of Week Three? Tuesday 80 90 90 90 2. What is the forecast using a 3-day simple moving average? Wednesdi 65 80 85 88 83 What would it be for a 2-day simple moving average? Thursday 85 65 78 73 73 83 70 3. What is the 3 day moving average with most recent weighted at..? 80 85 77 4. What would the Monday forecast be using exponential smoothing with alpha of 0.2? Monday 80 80 77 83 78 84 80 5. What would the forecast be using exponential smoothing with alpha of 0.7? Tuesday 70 80 82 80 81 83 80 How many should be in the office on Monday? Which forecasting option seems most reasonable and why? Wednesdi 60 70 77 75 74 80 73 Thursday 75 60 701 65 66 76 64 Friday 60 75 68 68 71 76 72 Monday's Forecast 60 65 68 63 73 64 Friday 75 80 84 81 Reviewing the first two weeks of data, are there any trends or cyclic variations to consider? The data you have may not be sufficient to make an informed operations management decision. Discuss in sufficient detail what else would be valuable as decisions are made Capacity - Break Even Utilization Forecasting
Step by Step Solution
There are 3 Steps involved in it

Get step-by-step solutions from verified subject matter experts