

Question: zy Section 3.1 - MAT 240: Applied S X Course Hero X b Homework Help and Textbook S X + X -> C A learn.zybooks.com/zybook/SNHUMAT240Master1/chapter/3/section/1
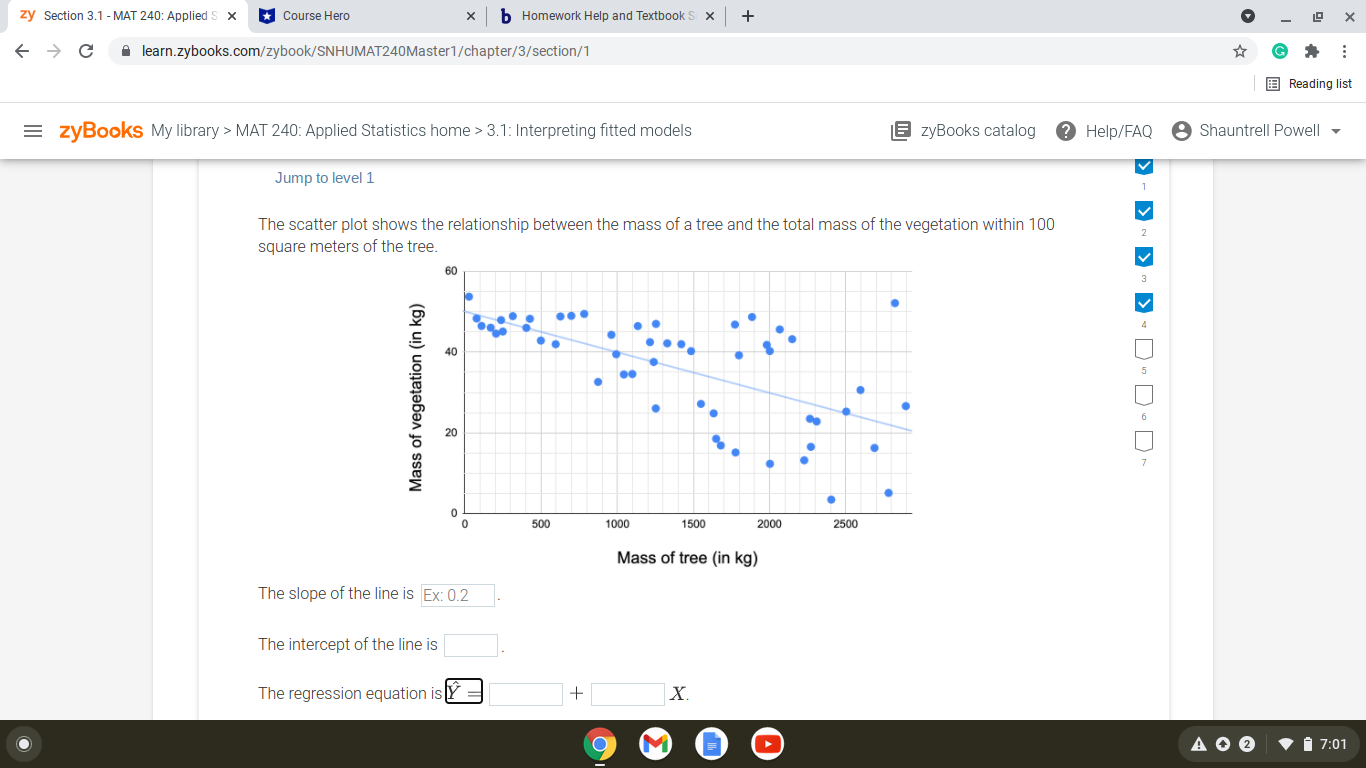
zy Section 3.1 - MAT 240: Applied S X Course Hero X b Homework Help and Textbook S X + X -> C A learn.zybooks.com/zybook/SNHUMAT240Master1/chapter/3/section/1 G Reading list =zyBooks My library > MAT 240: Applied Statistics home > 3.1: Interpreting fitted models zyBooks catalog ? Help/FAQ @ Shauntrell Powell V Jump to level 1 V The scatter plot shows the relationship between the mass of a tree and the total mass of the vegetation within 100 2 square meters of the tree. 60 40 Mass of vegetation (in kg) 20 0 500 1000 1500 2000 2500 Mass of tree (in kg) The slope of the line is Ex: 0.2 The intercept of the line is The regression equation is Y= + X. AO 2 17:01
Step by Step Solution
There are 3 Steps involved in it

Get step-by-step solutions from verified subject matter experts