For each of the following descriptions and data sets, prepare a graph in the singlesubject style that
Question:
For each of the following descriptions and data sets, prepare a graph in the single‐subject style that would accurately portray the results. Write a brief conclusion.
An A–B–A–B design was used to reduce the number of interruptions made in class by a child whose behavior was disrupting his second‐grade class. During treatment, the teacher was instructed to ignore the child’s interruptions and to pay special attention to the child when he was behaving productively (e.g., doing class work). The number of interruptions per 1‐hour recording session were as follows:
a. During first A: 12, 12, 7, 6, 6, 9, 8, 10, 9, 11
b. During first B: 9, 8, 9, 4, 3, 2, 2, 1, 4, 2
c. During second A: 4, 5, 10, 6, 12, 10, 10, 10, 12, 9
d. During second B: 9, 9, 2, 1, 1, 1, 0, 3, 4, 1 2. A multiple baseline across persons design was used to improve the foul shooting percentage of three basketball players during practices. A system was used in which successful shots earned points that could later be used to obtain more substantial reinforcers. Each of the following numbers represents the number of foul shots made for each 50 attempted. The underlined numbers are baseline data.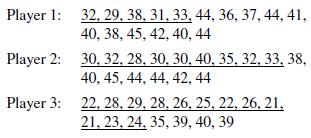
Step by Step Answer:
To represent the data you can create line graphs for each participant in the ABAB design and a multi...View the full answer