

Find the trigonometric Fourier series for the waveforms shown in Fig. 17-43. Plot the line spectrum of
Question:
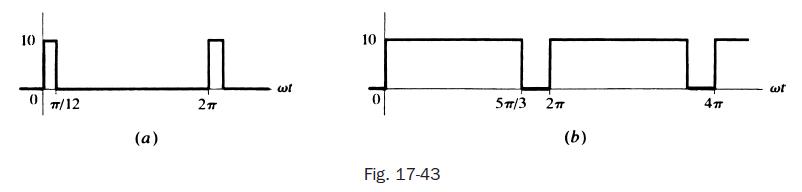
Find the trigonometric Fourier series for the waveforms shown in Fig. 17-43. Plot the line spectrum of each and compare.
Step by Step Answer:

This question has not been answered yet.
You can Ask your question!
Related Book For 

Schaum S Outline Of Electric Circuits
ISBN: 9781260011968
7th Edition
Authors: Mahmood Nahvi, Joseph Edminister
Question Posted:
