

Question: Answer the same questions as in Exercise 1.1 but using monthly stock returns for General Motors (GM), CRSP value-weighted index (VW), CRSP equalweighted index (EW),
Answer the same questions as in Exercise 1.1 but using monthly stock returns for General Motors (GM), CRSP value-weighted index (VW), CRSP equalweighted index (EW), and S\&P composite index from January 1975 to December 2008. The returns of the indexes include dividend distributions. Data file is m-gm3dx7508.txt (date, gm, vw, ew, sp).
Exercise 1.1:
Consider the daily stock returns of American Express (AXP), Caterpillar (CAT), and Starbucks (SBUX) from January 1999 to December 2008. The
data are simple returns given in the file d-3stocks9908.txt (date, axp, cat, sbux).
(a) Express the simple returns in percentages. Compute the sample mean, standard deviation, skewness, excess kurtosis, minimum, and maximum of the percentage simple returns.
(b) Transform the simple returns to \(\log\) returns.
(c) Express the log returns in percentages. Compute the sample mean, standard deviation, skewness, excess kurtosis, minimum, and maximum of the percentage log returns.
(d) Test the null hypothesis that the mean of the log returns of each stock is zero. That is, perform three separate tests. Use 5% significance level to draw your conclusion.
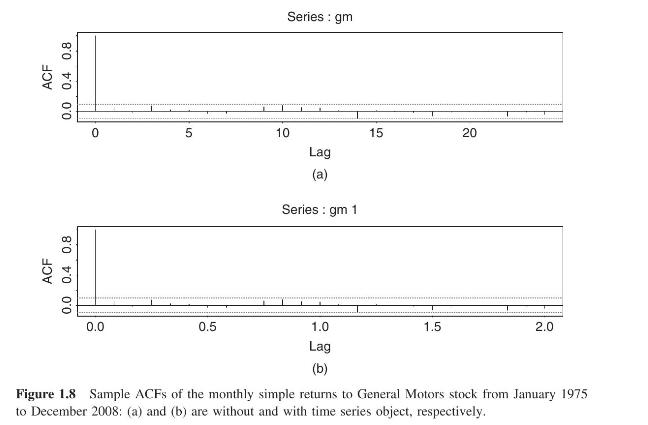
ACF 0.0 0.4 0.8 ACF 0.0 0.4 0.8 0 5 10 Series: gm Lag (a) Series: gm 1 15 20 20 0.0 0.5 1.0 1.5 2.0 Lag (b) Figure 1.8 Sample ACFS of the monthly simple returns to General Motors stock from January 1975 to December 2008: (a) and (b) are without and with time series object, respectively.
Step by Step Solution
There are 3 Steps involved in it

Get step-by-step solutions from verified subject matter experts