

Suppose the stock XYZ has been generally increasing in price over the past few months. In a
Question:
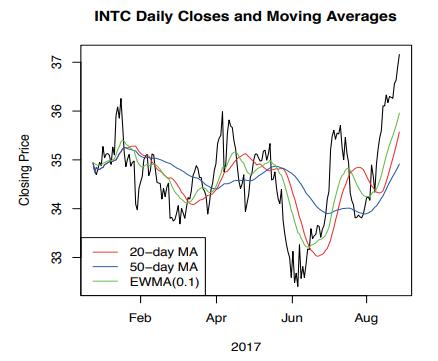
Suppose the stock XYZ has been generally increasing in price over the past few months. In a time series graph of the stock price, its 20 -day moving average, and its 50-day moving average, as in Figure 1.9, which curve will be highest, the price, the 20-day moving average, or the 50-day moving average? Which curve will be the next highest? Explain why.
Figure 1.9:
Step by Step Answer:

This question has not been answered yet.
You can Ask your question!
Related Book For 
Question Posted:
