

Question: Construct a Pareto chart of the data given in Exercise 19. Compare the Pareto chart to the pie chart. Which graph is more effective in
Construct a Pareto chart of the data given in Exercise 19. Compare the Pareto chart to the pie chart. Which graph is more effective in showing the relative importance of the mistakes made by job applicants?
Exercise 19
Refer to the data given in Exercise 17, and construct a pie chart. Compare the pie chart to the Pareto chart. Can you determine which graph is more effective in showing the relative usefulness of the job–hunting methods?
Exercise 17
A survey was conducted to determine how employees found their jobs. The table below lists the successful methods identified by 400 randomly selected employees. The data are based on results from the National Center for Career Strategies. Construct a Pareto chart that displays the given data. Based on these results, what appears to be the best method for someone seeking employment?
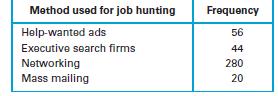
Method used for job hunting Help-wanted ads Executive search firms Networking Mass mailing Frequency 56 44 280 20
Step by Step Solution
3.28 Rating (148 Votes )
There are 3 Steps involved in it
a b c 22 d Adding the numbers in the second column we find that there are ... View full answer

Get step-by-step solutions from verified subject matter experts