

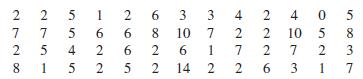
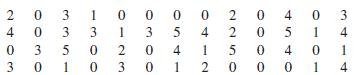
Question: Refer to the Dvorak data in Exercise 21 in Section 3.1 and construct a dotplot. Compare the result to the dotplot from Exercise 21 above.
Refer to the Dvorak data in Exercise 21 in Section 3.1 and construct a dotplot. Compare the result to the dotplot from Exercise 21 above. Based on the results, does either keyboard configuration appear to be better? Explain.
Exercise 21
The traditional keyboard configuration is called a Qwerty keyboard because of the positioning of the letters QWERTY on the left in the top row of letters. Developed in 1872, the Qwerty configuration supposedly forced people to type slower so that the early typewriters would not jam. Developed in 1936, the Dvorak configuration supposedly provides a more efficient arrangement by positioning the most used keys on the middle row (or “home” row), where they are more accessible.
A Discover magazine article suggested that you can measure the ease of typing by using this point rating system: Count each letter on the home row as 0, count each letter on the top row as 1, and count each letter on the bottom row as 2. For example, the word statistics would result in a rating of 7 on the Qwerty keyboard and 1 on the Dvorak keyboard, as shown below.
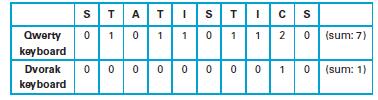
Qwerty Keyboard Word Ratings
Dvorak Keyboard Word Ratings
S TA Qwerty 0 1 0 keyboard Dvorak 000 keyboard TI 1 1 0000 S T I 0 1 1 1 1 00 S 2 0 (sum: 7) 1 0 (sum: 1)
Step by Step Solution
3.39 Rating (168 Votes )
There are 3 Steps involved in it
The dot plot for the Q wer ty keyboard ratings look... View full answer

Get step-by-step solutions from verified subject matter experts