

Question: The scatterplot in Figure 7.18 depicts paired data values consisting of the weight (in grams) and year of manufacture for each of 72 pennies. a.
The scatterplot in Figure 7.18 depicts paired data values consisting of the weight (in grams) and year of manufacture for each of 72 pennies.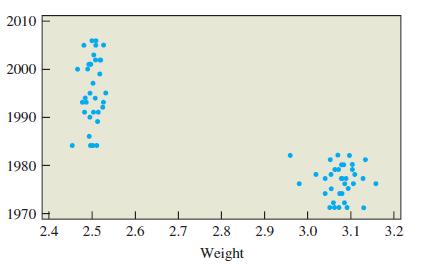
a. Considering the complete collection of data, does there appear to be a correlation?
b. Consider the grouping of data points on the left. Does there appear to be a correlation for these data? For these data only (at the left in the scatterplot), comment on the weights and years of manufacture.
c. Consider the grouping of data points on the right. Does there appear to be a correlation for these data? For these data only (at the right in the scatterplot), comment on the weights and years of manufacture.
d. What is a reasonable explanation for these results?
2010 2000 1990 1980 1970 2.4 2.5 2.6 2.7 2.8 Weight 2.9 L 3.0 3.1 3.2
Step by Step Solution
3.38 Rating (173 Votes )
There are 3 Steps involved in it
a ab b c d Yes there appears to be a negative corr... View full answer

Get step-by-step solutions from verified subject matter experts