

Question: The stack plot in Figure 3.25 shows the numbers of bachelors degrees awarded to males and females since 1970. The last few years are projections.
The stack plot in Figure 3.25 shows the numbers of bachelor’s degrees awarded to males and females since 1970. The last few years are projections.
a. Estimate the numbers of bachelor’s degrees to be awarded to males and to females (separately) in 2020.
b. About when were the numbers of bachelor’s degrees equal for males and females?
c. Comment on the overall trend.
d. Do you think the stack plot is an effective way to display these data? Briefly discuss other graphics that might have been used instead.
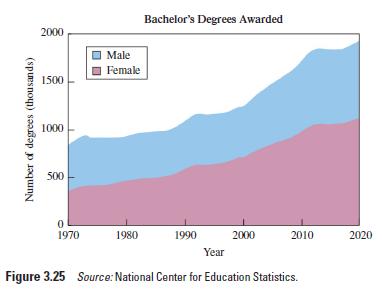
Bachelor's Degrees Awarded Male Female 1970 1980 1990 2000 2010 Year Figure 3.25 Source: National Center for Education Statistics. Number of degrees (thousands) 2000 1500 1000 500 2020
Step by Step Solution
3.45 Rating (161 Votes )
There are 3 Steps involved in it
n mle bthelr hlders 1950000 N f femle bthelr hlders 1050000 b they never be equl there is n inresi... View full answer

Get step-by-step solutions from verified subject matter experts