

Question: 16 Refer to Table 10.11 Form the overall table. summing over social class Compare the proportions of Catholics and Protestanis favoring the death penalty, both
16 Refer to Table 10.11 Form the overall table. summing over social class Compare the proportions of Catholics and Protestanis favoring the death penalty, both ignoring and controlling social class. What type of relationship do these data satisfy? TABLE 10.11 Social Class Working Class Middle Class Death Penalty Favor Oppose Favor Oppose Religion Catholic Protestant 240 160 30 70 80 20 200 200
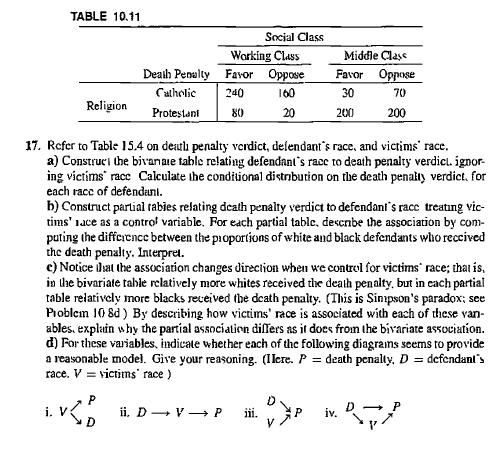 TABLE 10.11 Social Class Working Class Middle Class Death Penalty Favor Oppose Favor Oppose Catholic 240 160 30 70 Religion Protestant 80 20 200 200
TABLE 10.11 Social Class Working Class Middle Class Death Penalty Favor Oppose Favor Oppose Catholic 240 160 30 70 Religion Protestant 80 20 200 200 17. Refer to Table 15.4 on death penalty verdict, defendant's race, and victims' race. a) Construct the bivanate table relating defendant's race to death penalty verdict. ignor- ing victims race Calculate the conditional distribution on the death penalty verdict. for each race of defendant. b) Construct partial rabies relating death penalty verdict to defendant's race treating vic- tims' lace as a control variable. For each partial table, describe the association by com- puting the difference between the proportions of white and black defendants who received the death penalty. Interpret. c) Notice that the association changes direction when we control for victims race; that is, in the bivariate table relatively more whites received the death penalty, but in each partial table relatively more blacks received the death penalty. (This is Simpson's paradox; see Problem 108d) By describing how victims' race is associated with each of these van- ables, explain why the partial association differs as it does from the bivariate association. d) For these variables, indicate whether each of the following diagrams seems to provide a reasonable model. Give your reasoning. (Ilere. P = death penalty, D = defendant's race. V victims' race) ii. D V P iii. iv.
Step by Step Solution
There are 3 Steps involved in it

Get step-by-step solutions from verified subject matter experts