

Question: Explain in what ways the decision-rule graph used in Chapter 7 to evaluate whether a population is materially misstated is similar to and different from
Explain in what ways the decision-rule graph used in Chapter 7 to evaluate whether a population is materially misstated is similar to and different from the appropriate graph for stratified mean-per-unit estimation. Assuming a total allowable error of \($60,000\), a Beta risk of 5%, and an Alpha risk of 100% for the population used in questions 8-4 and 8-7, prepare the decision-rule graph. Prepare the minimum adjusting entry required to make the population fairly stated.
Question 8-7:
Calculate the combined standard error of the population if the standard deviation in question 8-4 is 500 in stratum 1 and 300 in stratum 2. (Ignore the finite correction factor.)
Question 8-4:
Explain how the point estimate for the total population is calculated using stratified sampling. Calculate the point estimates for mean-per-unit, difference, and ratio estimation from the following information:
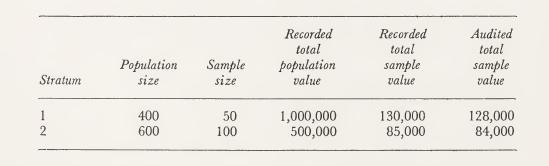
Recorded Recorded Audited total total total Population Sample population sample sample Stratum size size value value value 11 400 50 1,000,000 130,000 128,000 2 600 100 500,000 85,000 84,000
Step by Step Solution
3.44 Rating (160 Votes )
There are 3 Steps involved in it

Get step-by-step solutions from verified subject matter experts