

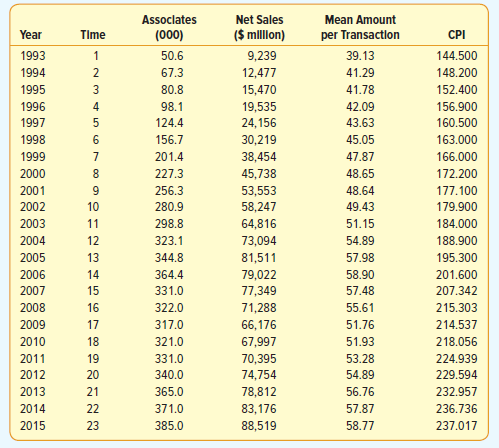
Question: Develop a trend equation for the net sales ($ million) for Home Depot. Consider both a linear trend and a nonlinear trend. Which one would
Assoclates Net Sales Mean Amount ($ milllon) per Transaction Year Time (000) CPI 50.6 1993 39.13 9,239 144.500 41.29 1994 2 67.3 12,477 148.200 152.400 1995 3 80.8 15,470 41.78 1996 98.1 19,535 42.09 156.900 1997 124.4 24,156 43.63 160.500 156.7 1998 30,219 45.05 163.000 47.87 1999 201.4 38,454 166.000 45,738 2000 8. 227.3 48.65 172.200 2001 53,553 48.64 256.3 177.100 280.9 49.43 2002 10 58,247 179.900 2003 11 298.8 64,816 51.15 184.000 2004 12 323.1 73,094 54.89 188.900 2005 13 344.8 81,511 57.98 195.300 2006 14 364.4 79,022 58.90 201.600 331.0 2007 15 77,349 57.48 207.342 322.0 2008 16 71,288 55.61 215.303 2009 17 317.0 66,176 51.76 214.537 2010 18 321.0 67,997 51.93 218.056 2011 224.939 19 331.0 70,395 53.28 54.89 2012 20 340.0 74,754 229.594 2013 21 365.0 78,812 56.76 232.957 83,176 2014 22 371.0 57.87 236.736 2015 23 385.0 88,519 58.77 237.017
Step by Step Solution
3.38 Rating (173 Votes )
There are 3 Steps involved in it
The linear trend line for net sales is Y 14185 3470t The logarithmic trend li... View full answer

Get step-by-step solutions from verified subject matter experts
Document Format (2 attachments)
1511_605d88e13a1ea_675672.pdf
180 KBs PDF File
1511_605d88e13a1ea_675672.docx
120 KBs Word File