

Question: Simulate, as in Example 2.2, 100 values of the three series that follow an ARMA model. For instance, an AR(2) or ARMA(1,1). Introduce in the
Simulate, as in Example 2.2, 100 values of the three series that follow an ARMA model. For instance, an AR(2) or ARMA(1,1). Introduce in the three series an outlier of size 3 and compare the results of univariate detection using the programs tso, arima.rob and outlierLasso with multivariate detection using the program outliers.hdts. Verify that the the multivariate detection is more powerful than the univariate detection.
Example 2.2:
The R command arima.sim generates stationary ARMA processes. Some time series are simulated following low orders ARMA models and their sample ACFs are computed.
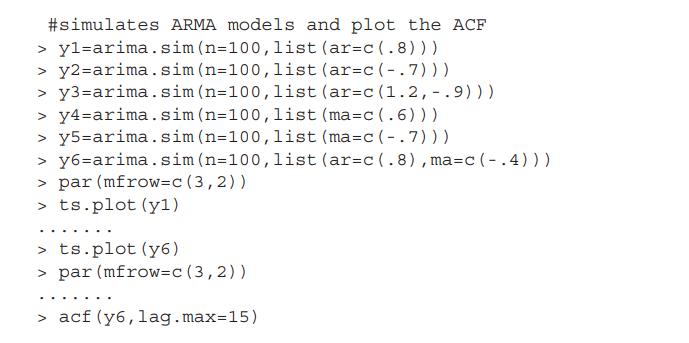
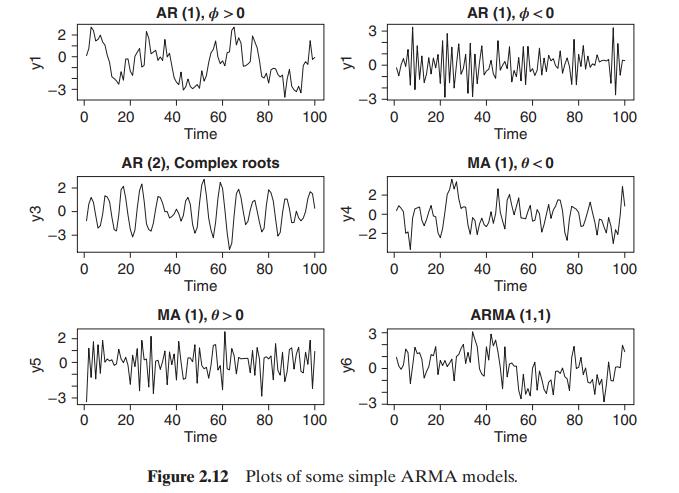
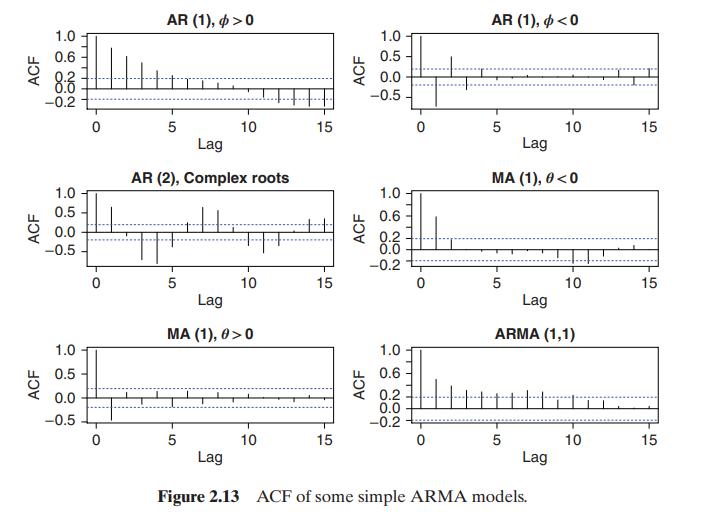
Figure 2.12 shows some simulated time series and Figure 2.13 the corresponding sample ACFs. Note that an AR(2) model with complex roots generates pseudo-cyclical behavior.
#simulates ARMA models and plot the ACF > yl=arima.sim (n=100, list (ar=c(.8))) > y2=arima.sim (n=100, list (ar=c(-.7))) > y3=arima.sim (n=100, list (ar=c (1.2, - .9))) > y4=arima.sim (n=100, list (ma=c(.6))) > y5=arima.sim (n=100, list (ma=c(-.7))) > y6=arima.sim (n=100, list (ar=c(.8), ma=c(-4))) > par (mfrow=c (3,2)) > ts.plot (y1) > ts.plot (y6) > par (mfrow=c (3,2)) > acf (y6, lag.max=15)
Step by Step Solution
3.31 Rating (154 Votes )
There are 3 Steps involved in it

Get step-by-step solutions from verified subject matter experts