The data presented in Table 12.10 gives the lifetime (in hours) of cell phone batteries based on
Question:
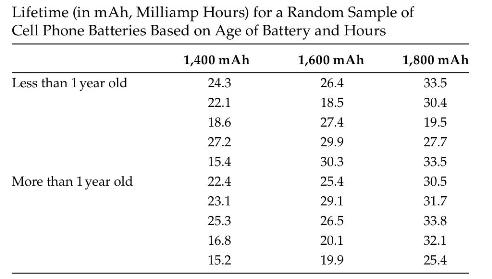
The data presented in Table 12.10 gives the lifetime (in hours) of cell phone batteries based on the age of the battery and the capacity of the battery (in milliamps per hour).
a. Which is the row factor and which is the column factor?
b. How many levels are there for each factor?
c. How many replicates are in each cell?
d. Using Minitab, determine if there is a difference in the mean lifetime of cell phone batteries based on age and capacity.
e. Is there an interaction between the age of the cell phone and the capacity?
f. Create a main effects plot and an interaction plot and comment on whether these plots support your findings.
g. Check any relevant model assumptions and describe any violations that you see.
Table 12.10
Step by Step Answer:

This question has not been answered yet.
You can Ask your question!