The skewness of a variable can be used as a measure of how symmetrical a distribution is.
Question:
The skewness of a variable can be used as a measure of how symmetrical a distribution is. If a variable is normally distributed, the skewness will be approximately equal to 0 . If the skewness is positive, this indicates that more observations are below the mean than are above the mean (i.e., the data is rightskewed), and if the skewness is negative, this indicates that there are more observations above the mean than are below the mean (i.e., the data is left skewed). The formula to calculate the skewness is as follows:
\[
\text { Skewness }=\frac{n}{(n-1)(n-2)} \cdot \sum_{i=1}^{n}\left(\frac{x_{i}-\bar{x}}{s}ight)^{3}
\]
where \(n\) is the sample size, \(x_{i}\) are the individual observations, \(\bar{x}\) is the sample mean, and \(s\) is the sample standard deviation for the given data.
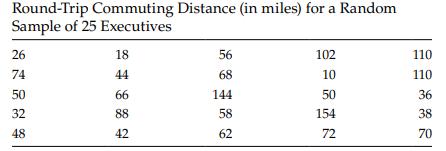
a. For the commuting distance data given in Table 2.1, calculate the value of the skewness.
b. Does the measure of skewness make sense for this data set?
Table 2.1
Step by Step Answer: